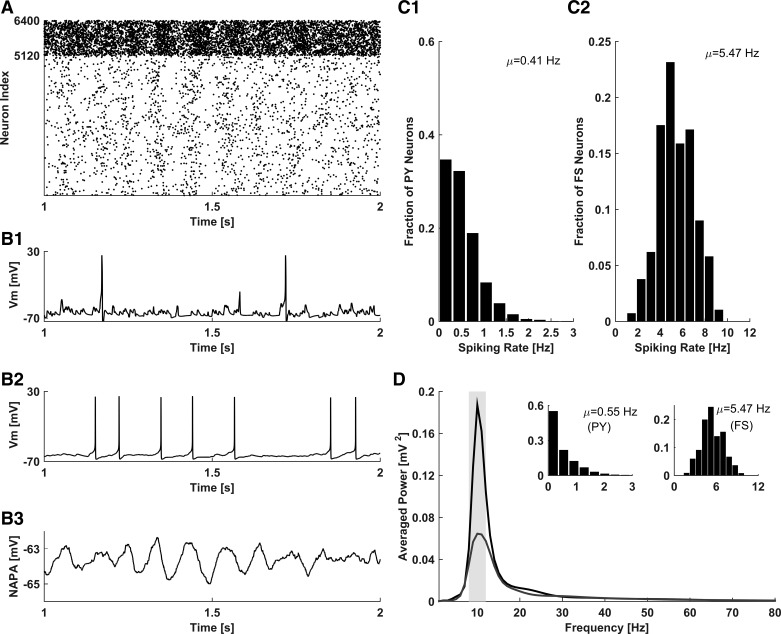
Fig. 2.
Characterization of intact network activity in the resting (nonattending) state. A: raster plot of spiking activity in the network (PY neurons indexes: 1–5,120; FS neurons indexes: 5,121–6,400). B: membrane potential of a representative PY neuron (B1), membrane potential of a representative FS neuron (B2); and NAPA, calculated as an average over membrane potentials of all PY and FS model neurons (B3). C: firing rate distributions of model PY (C1) and FS (C2) neurons. D: spectral power distribution of NAPA (black trace), exhibiting a peak in the alpha band (gray bar in 8- to 12-Hz range). Gray trace illustrates the spectral power distribution of NAPA for a network without callosal connections; inset indicates the firing rate distributions of model PY (left inset) and FS (right inset) neurons in this condition.

