Fig. 3.
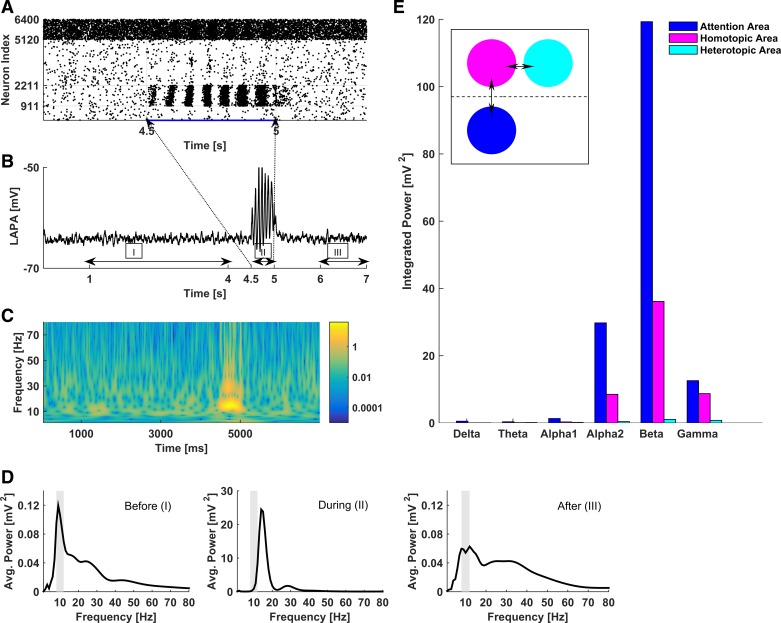
Response of the network to unilateral attention-like stimulation, modeled as a localized transient stimulation of model PY neurons (400 PY neurons subject to stochastic Poisson stimulation at 200 Hz for 500 ms; other simulation conditions are the same as in Fig. 1). A: raster plot of network activity in response to the stimulation at time 4.5 s, indicating locally coherent collective oscillations in the stimulated area. Blue trace under the raster plot represents the injected current. B: LAPA dynamics in the stimulated area before (I), during (II), and after (III) the stimulation. C: time-frequency plot of the LAPA in B. Logarithmic (base 10) scaling has been applied to accentuate the different responses during different time windows. D: spectral power distributions of LAPA in the stimulated area before, during, and after the stimulation, corresponding to I, II, and III in B, respectively. The dominance of beta rhythm during the stimulation should be compared with the dominance of alpha rhythm both before and after the stimulation. E: localized and specific activation of the contralateral region in response to unilateral attention-like stimulation. Bars show integrated spectral power across different bands during unilateral stimulation at 200 Hz, measured in the stimulated area (blue), the homotopic contralateral area (magenta), and the heterotopic contralateral area (cyan). Inset schematically shows the arrangement of these areas, with the double arrows indicating the connections among them.

