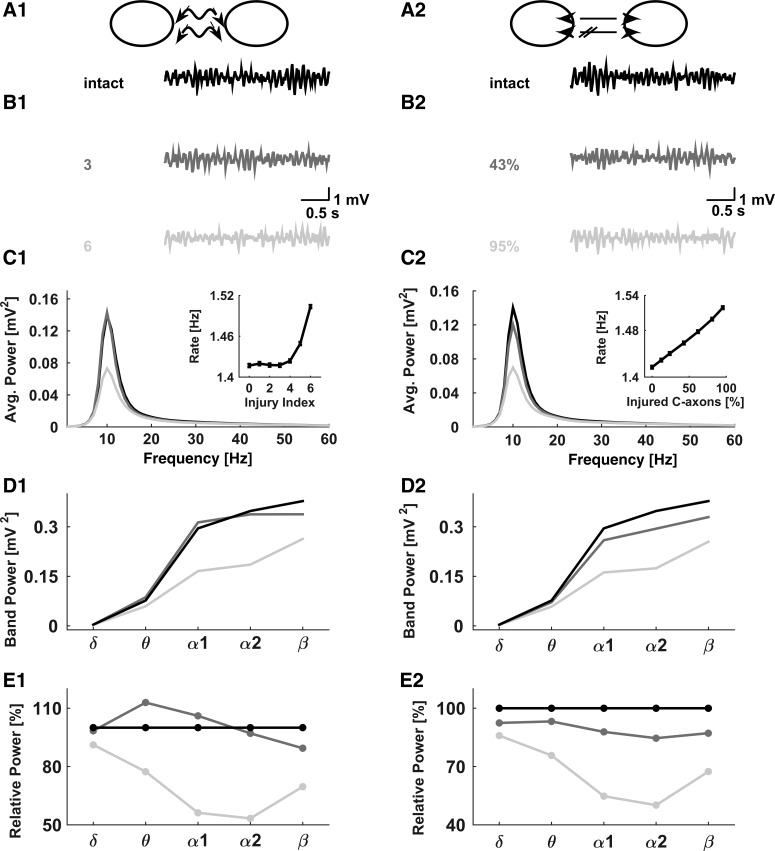
Fig. 4.
Slowing down in networks with injured callosal axons. Left panels represent the scenario of strained callosal axons; right panels represent the scenario of partially eliminated callosal connections. A: schematics illustrating the straining (A1) and partial connectivity (A2) scenarios. B1: from top to bottom, typical NAPA traces represent intact model network (injury severity index = 0), mildly injured network (injury severity index = 3), and severely injured network (injury severity index = 4). B2: from top to bottom, typical NAPA traces represent intact model network (PContra = 0.2), mildly injured network (PContra = 0.11, 43% of callosal axons not conducting), and severely injured network (PContra = 0, 95% of callosal axons not conducting). C: spectral distributions for intact and injured networks for injury scenarios as described in B. Grayscale code is the same as in B. Insets show network-averaged firing rates for different injury scenarios. Data points are means ± SE (n = 60). D: spectral power in different oscillation bands for different injury scenarios. E: spectral power in different oscillation bands, normalized with respect to the intact network, for different injury scenarios. In C–E, the data are averaged over 60 statistically independent realizations.

