Fig. 6.
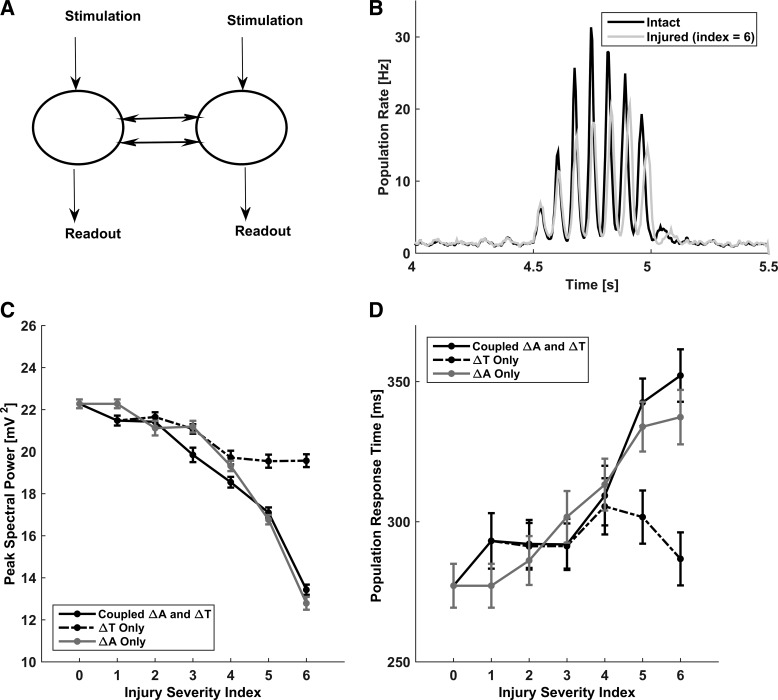
Effect of callosal injury on the network response to attention-like stimulation. A: schematic of the simulation setup. Two local subnetworks, connected by callosal axons, were stimulated at the same time by stochastic Poisson stimuli, and their response to the stimulation was measured for different levels of callosal injury. B: activity traces of population response to stimulation, averaged over all model neurons in the stimulated subnetworks. Black trace represents the intact network (injury scenario 0). Gray trace represents the injured network (injury scenario 6; ΔA = 85%, ΔT = 70%). C: peak spectral power during attention-like stimulation vs. injury severity index: coupled amplitude and latency changes (solid black), amplitude not varied (dashed black), and latency not varied (solid gray). D: population response time to attention-like stimulation vs. injury severity index for the different scenarios in C. In C and D, data points are means ± SE (n = 60).

