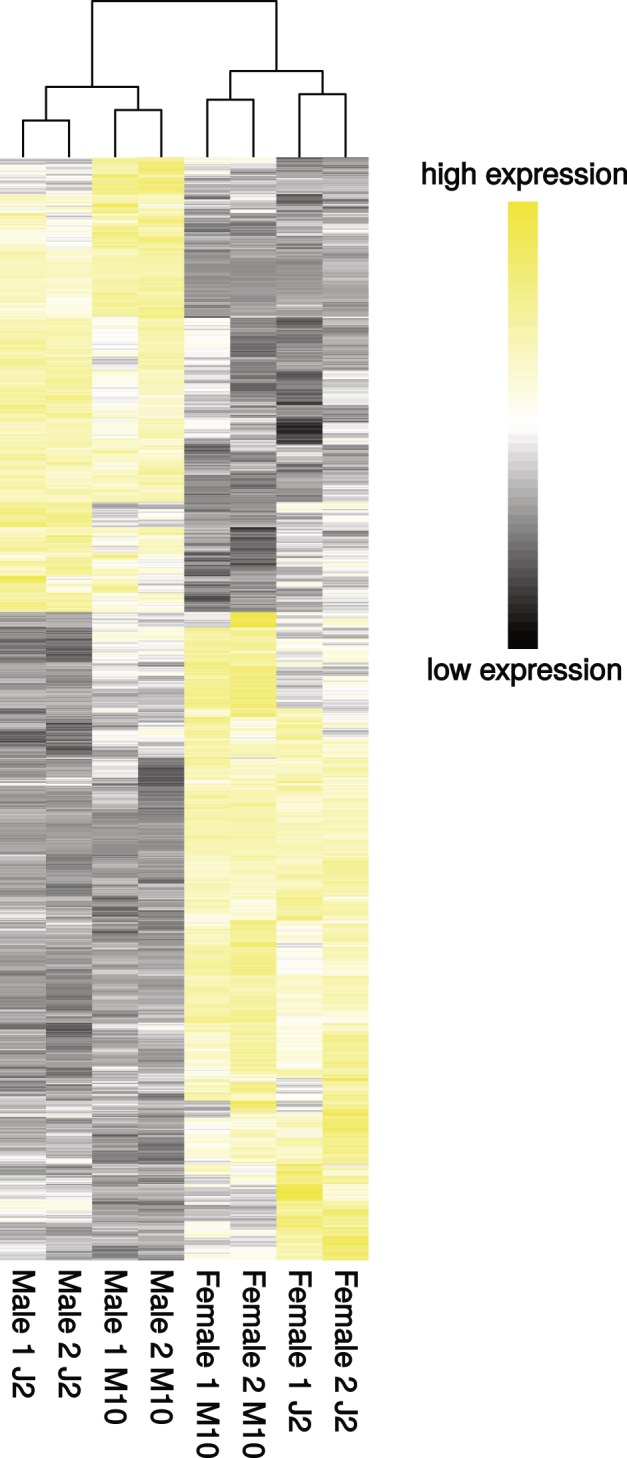
Fig. 2.—

Heatmap showing all sex-biased genes with more than a 2-fold expression difference between males and females in the two-factor (combined) analysis. Clustering is based on Euclidean distances of RPKM values.

Heatmap showing all sex-biased genes with more than a 2-fold expression difference between males and females in the two-factor (combined) analysis. Clustering is based on Euclidean distances of RPKM values.