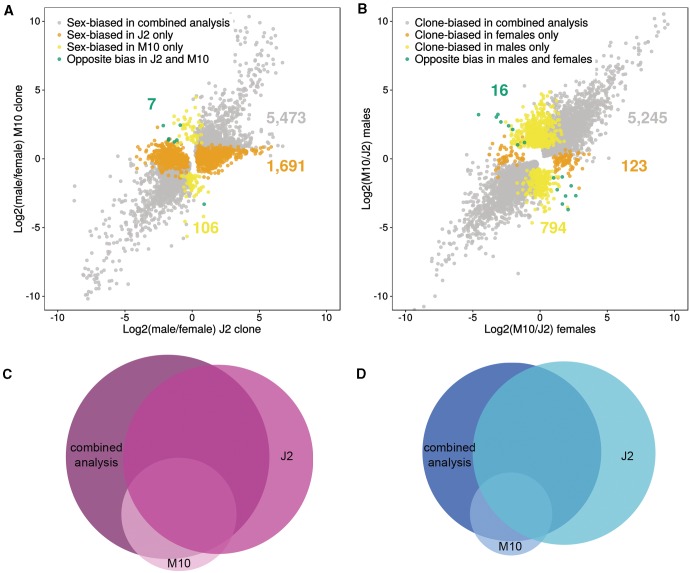
Fig. 3.—
Results of the one-factor analysis showing sex-biased genes in each clone separately. (A) Dot plot showing the ratio of male/female expression for the J2 clone and the M10 clone, highlighting those genes that show differences in sex bias in the one-factor analysis compared with the two-factor (combined) analysis. Genes identified as sex-biased in the two-factor analysis or in the one-factor analysis for both clones are depicted in gray. Genes detected as sex-biased only in the J2 clone are shown in orange, whereas those detected as sex-biased only in the M10 clone are shown in yellow. Green dots indicate genes that are significantly female-biased in one clone, but significantly male-biased in the other. (B) Dot plot showing the ratio of M10/J2 expression for females and males. Genes identified as clone-biased in the two-factor analysis or in the one-factor analysis in both sexes are depicted in gray. Genes detected as clone-biased only in females are shown in orange, whereas those detected as clone-biased only in males are shown in yellow. Green dots indicate genes that are significantly M10-biased in one sex, but significantly J2-biased in the other. (C) Proportional Venn diagram for female-biased genes in the two-factor analysis and in each of the clones in the one-factor analysis. (D) Proportional Venn diagram for male-biased genes in the two-factor analysis and in each of the clones in the one-factor analysis.

