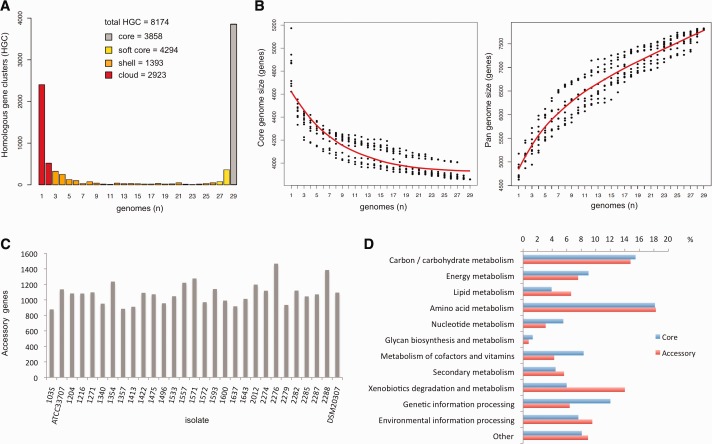
Fig. 2.—
Rhodococcus equi core- and pangenome. (A) Pangenome distribution into strict core (present in 100% of isolates), soft-core (95% of isolates), cloud (≤2 genomes, cutoff defined as the class next to most populated noncore HGC) and shell (rest of HGCs). (B) Size estimation of core genome (left) and pangenome (right) by sequential sampling of n genomes in 10 random combinations using Tettelin exponential decay function fit (orthology threshold ≥50% for C and S) (Tettelin et al. 2005). Analyses in (A) and (B) performed with Get_Homologues (Contreras-Moreira and Vinuesa 2013). (C) Distribution of accessory genes in R. equi isolates. The (manually curated) complete 103S genome (Letek et al. 2010) was subjected to automated annotation as a control; the lower number of accessory genes in the manually annotated 103S sequence (n=667) suggests that the gene content is overestimated in the draft genome sequences. (D) KEGG categories of core and accessory genome HGCs. Only 15.6% of the accessory genes could be categorized versus 45.2% for the core genome, indicating that the accessory genome is a source of functional innovation in R. equi.

