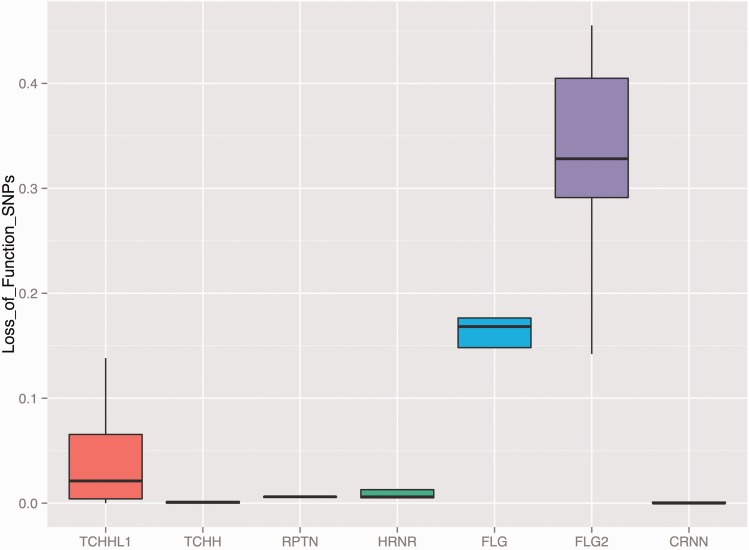
Fig. 3.—
(D) The frequency of SFTP gene family loss-of-function variants. This x-axis of the boxplot indicates the genes neighboring FLG. The y-axis indicates the cumulative allele frequency of loss-of-function variants affecting these genes in 1000 Genomes Phase 3 dataset populations. All the genes represented in this figure are members of the SFTP gene family and have similar gene organization with FLG, carrying large exonic repeats.

