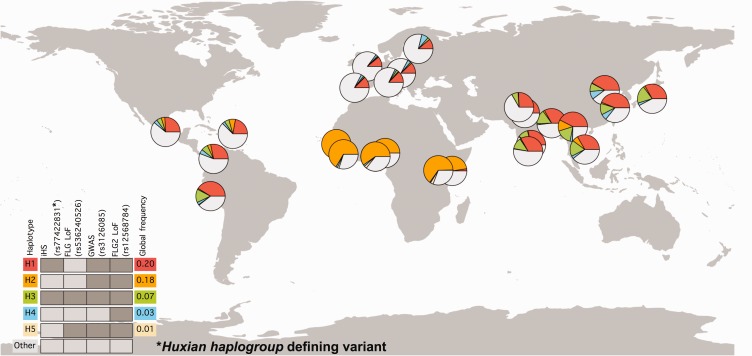
Fig. 4.—
(C) Geographic distribution of haplotypes carrying functionally relevant variants. Distribution of most common combinations of putatively functional variants were shown across the world. The colors in the pie-charts represent the relative frequencies of major haplotypes. The individual SNPs that define different haplotypes were indicated on top of the legend placed bottom left of the map. The dark gray bars indicate the presence of the derived allele in that haplotype, whereas light-gray indicate that the haplotype carry the ancestral allele. The color-coded haplotypes indicated by H1–H5 corresponds to the colors in the pie-charts. Other indicate haplotypes not covered in this chart. The global allele frequencies of each haplotype were indicated in the right side of the legend. The H1 (red) and H3 (green) haplotypes correspond to the Huxian haplogroup. Note the major increase in allele frequency of the Huxian haplogroup in Eastern Asian and Southern Asian populations.

