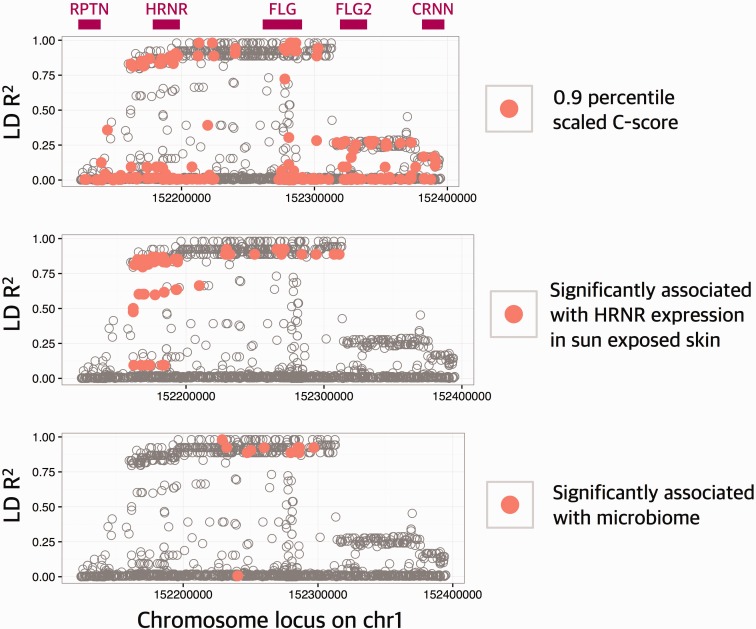
Fig. 5.—
Putatively functional variants are linked with Huxian haplogroup. The x-axis of this plot shows the chromosomal location. The y-axis shows the LD R2 between all reported single nucleotide variants in CHB population and rs77422831, which is the defining variant for Huxian haplogroup. Top panel shows the approximate locations of genes. In each panel, a different functional aspect of the variation was considered. In the top panel, the variants with CADD scores in the 90th percentile (CADD = 6.714355) were indicated with red points. In the middle panel, the variants that are significantly (P < 10−5) associated with the expression levels of HRNR were indicated with red points. In the bottom panel, the variants that are associated with skin microbiome diversity (P < 0.001) were indicated by red points.

