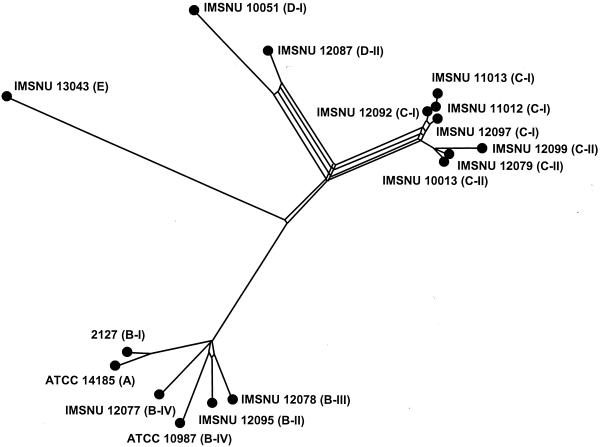
FIG. 3.
Split graph showing the relationships between rpoB, gyrB, pycA, mdh, mbl, and mutS for 16 randomly selected strains of the B. cereus group. The split graph was generated by using SplitsTree 3.1 (16) from pairwise distances based on the maximum-likelihood model. The fit value was 0.75, indicating that the phylogenetic signal in the data is represented moderately well by the split graph. All branch lengths are drawn to scale. Cluster names are indicated in parentheses alongside the corresponding strain names.

