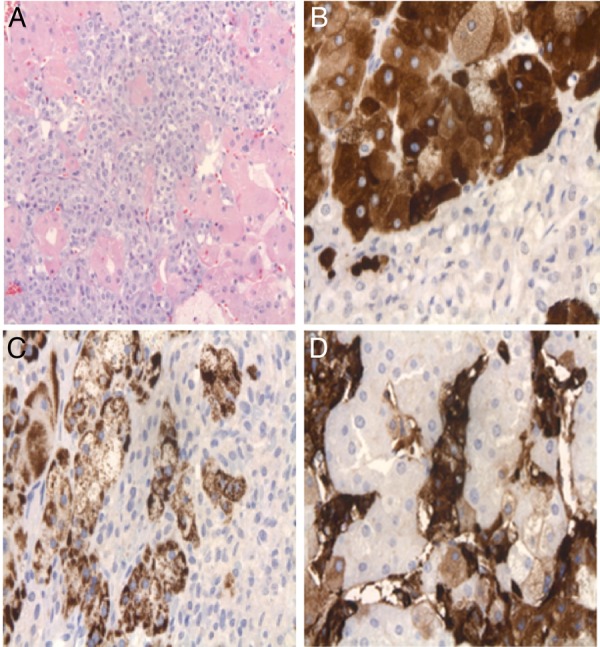
Figure 4.

Histology of mixed corticomedullary tumour. (A) Pheochromocytes (centre, basophilic) mixed with adrenal cortical cells (with eosinophilic cytoplasm). (B) Adrenal cortical cells stain (+) for inhibin-A (upper left); pheochromocytes staining (−) (lower right). (C) Adrenal cortical component expressing melan-A. (D) Pheochromocytes stain (+) for chromogranin A; adrenal cortical cells stain (−).
