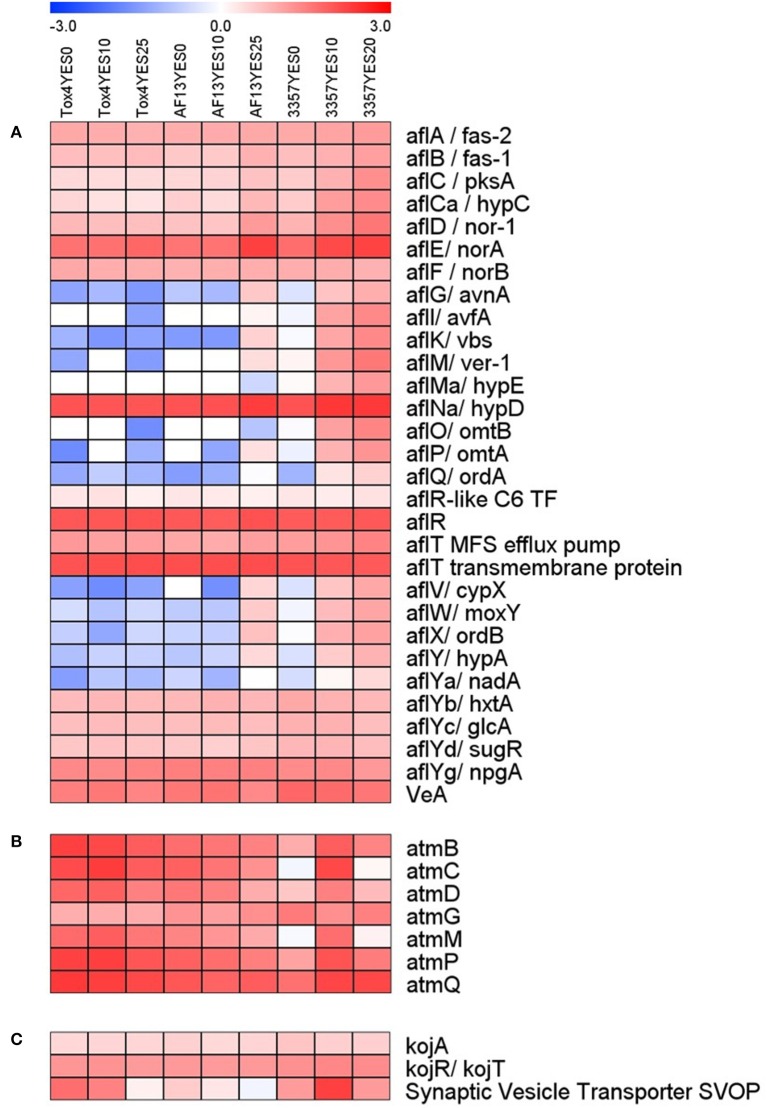
Figure 3.
Heatmap of aflatoxin, aflatrem, and kojic acid biosynthetic gene expression with increasing oxidative stress. The expression of aflatoxin (A), aflatrem (B), and kojic acid (C) biosynthetic genes are plotted with colors corresponding to the level of expression of the genes in each condition. Here, FPKM expression values were log10 transformed and plotted based on the color key increasing from blue to red using MeV 4.9. Isolate and treatment combinations for each column are consistent for each heatmap.

