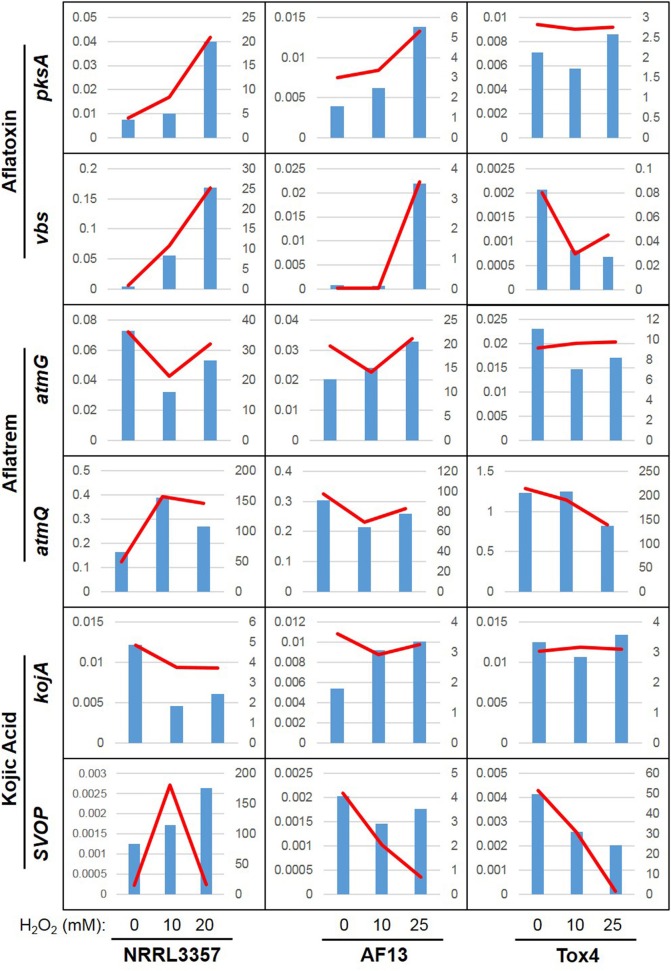
Figure 4.
Relative expression and FPKM associations for select secondary metabolite genes. Real-time PCR was used to determine the relative expression of six select secondary metabolite genes: pksA and vbs (aflatoxin), atmG and atmQ (aflatrem), and kojA and SVOP (kojic acid). Relative expression is indicated by the blue bars scaled to the left y-axis. The RNA sequencing-derived FPKM data is indicated by the red line scaled to the right y-axis. The plots are organized into three columns corresponding to data obtained from NRRL3357, AF13, Tox4, respectively, with each plot containing data from the 0, 10, and 20/25 mM H2O2 treatments in increasing order.

