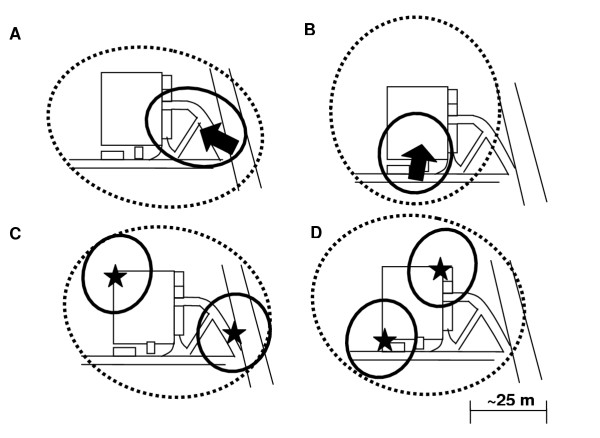
Figure 1.

An aerial view of the use of a patch antenna at a simulated patient's home. The AP – clients connection (A and B) and peer-to-peer connection (C and D) configurations were tested. The arrows indicate the locations and the beaming directions of the APs with a patch antenna. The stars indicate the locations of the wireless devices in the peer-to-peer connections. The link statuses were measured as described in the Methods: the solid and dashed circles indicate "excellent" and "good" statuses, respectively. Panel A: Simulated ambulance parked on the street. Panel B: Simulated ambulance parked in the parking lot of the house. C and D: Peer-to-peer connection was created between two wireless clients.
