
Figure 4. Begg’s funnel plot to assess publication bias in the meta-analysis of a potential association between the -137 polymorphism (rs187238) and risk of hepatocellular carcinoma across all study participants according to different genetic models.
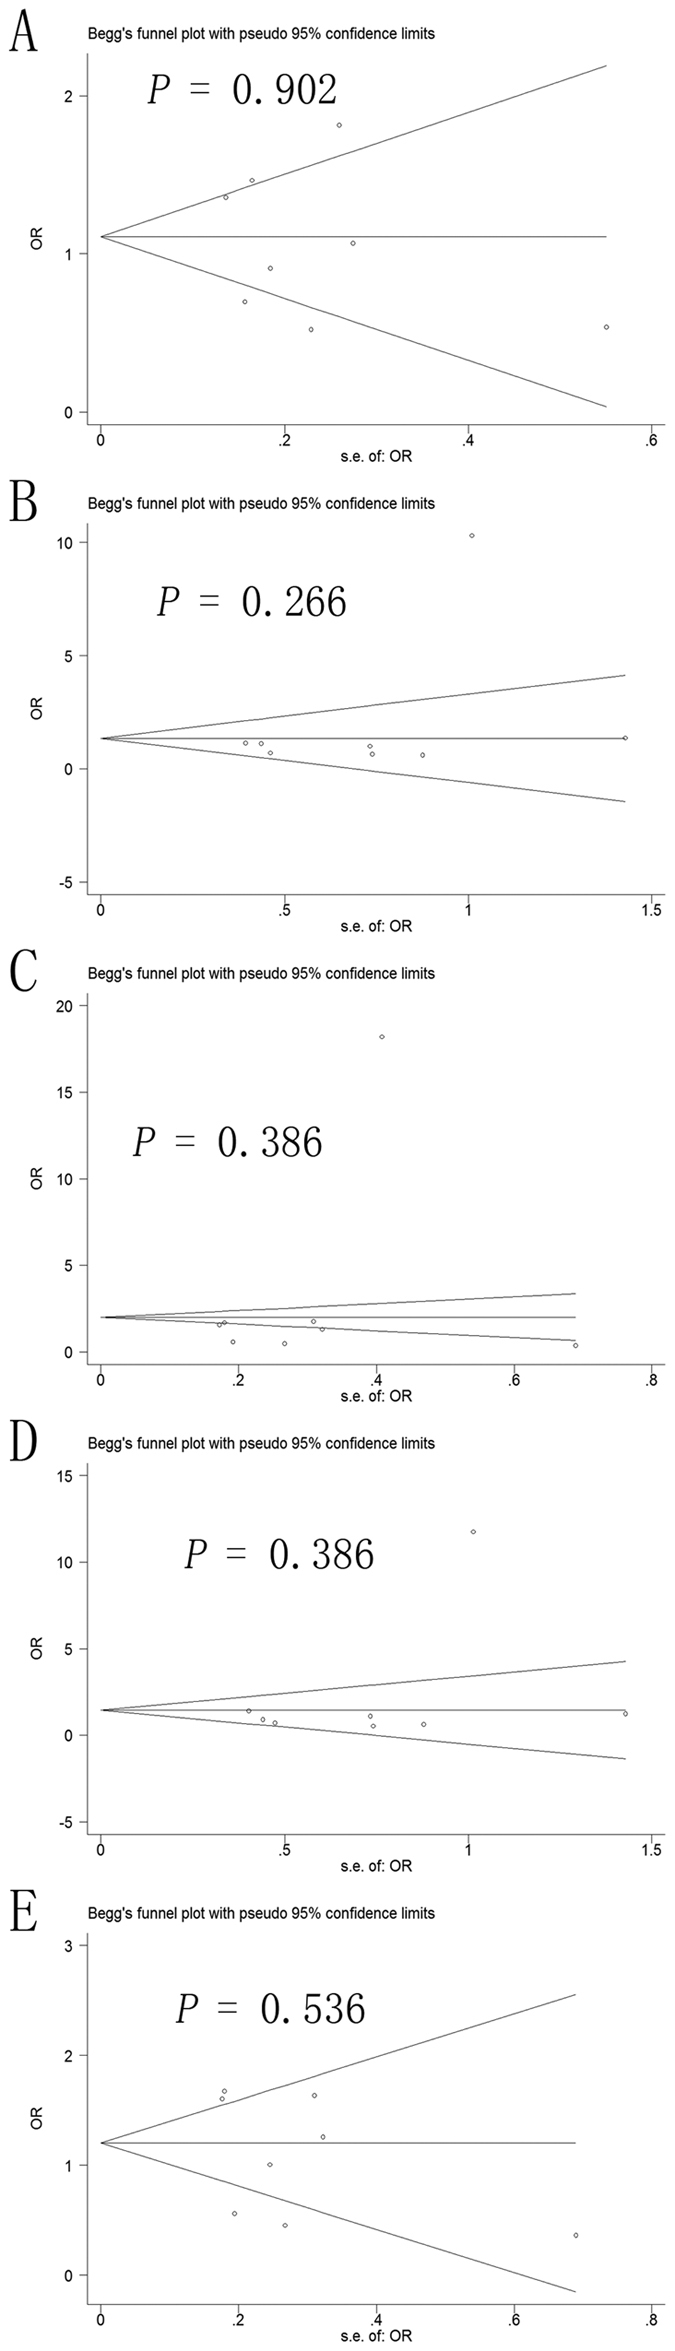
(A) allelic (C-allele vs. G-allele), (B) recessive (CC vs. GC + GG), (C) dominant (GG vs. GC + CC), (D) homozygous (CC vs. GG) and (E) heterozygous (GC vs. GG).