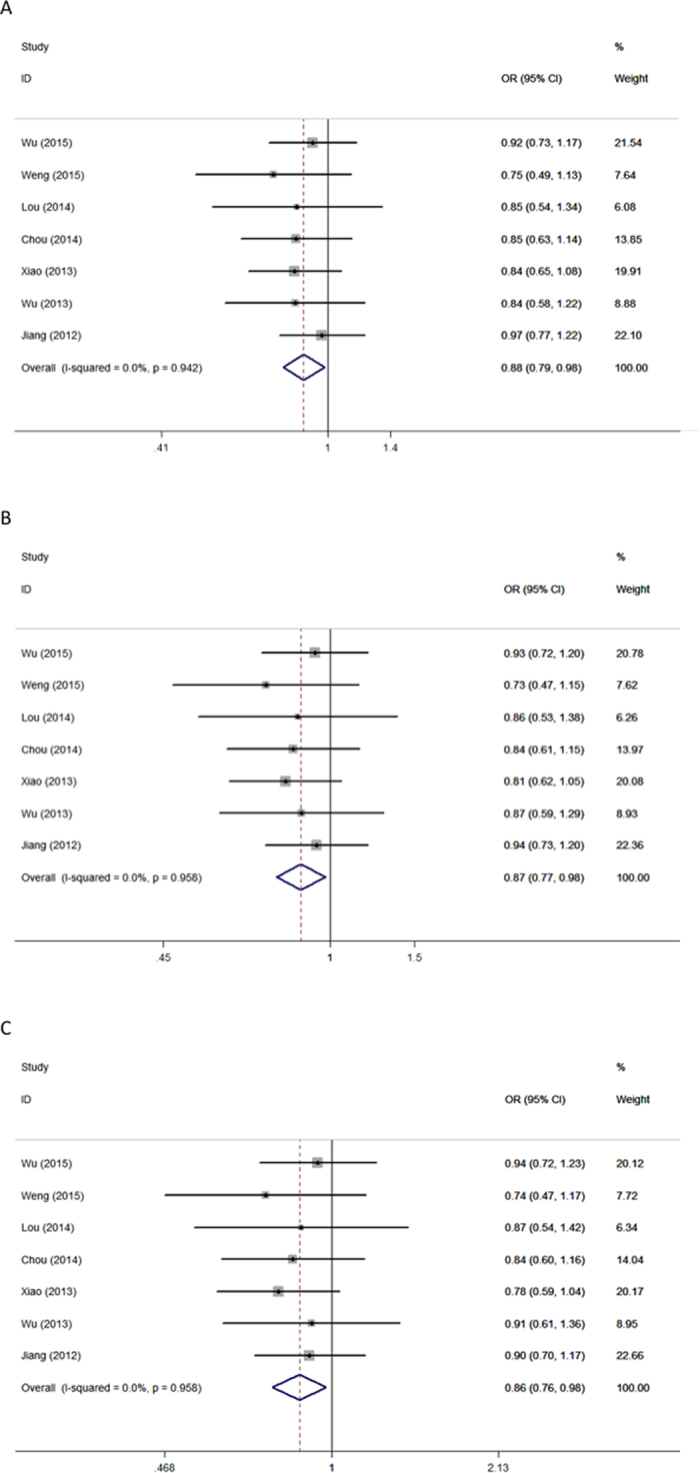
Figure 2. Forest plot of cancer risk associated with CD44 polymorphism rs11821102 in using different sources of controls.

Models represented in (A) dominant and (B) heterozygous. Each square represents a study, and the area of each square is proportional to the weight of the study. The diamond represents the summary OR and 95% CI. OR: odds ratio; CI: confidence interval.
