
Figure 4. Begg’s funnel plot assessing evidence of publication bias in eligible studies used in the study.
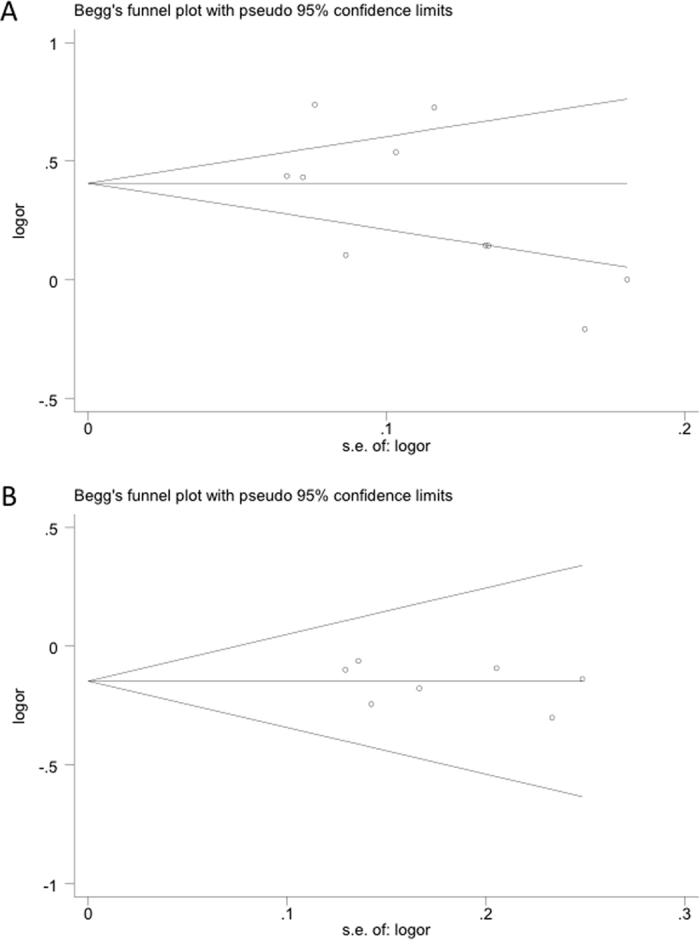
Polymorphisms represented in (A) rs13347 under the allele contrast model and (B) rs11821102 under the heterozygous model. The horizontal line in the figure represents the overall estimated log (OR). The two diagonal lines indicate the pseudo 95% confidence limits of the effect estimate. Log (OR): log-transformed OR; OR: odds ratio.