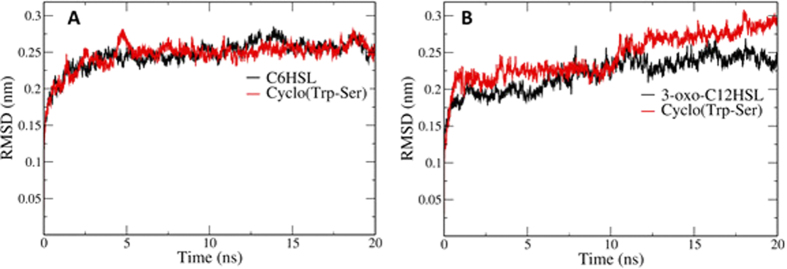
Figure 5. RMSD profile of simulated complexes.
(A) Black color line represents CviR complex with signaling molecule, and red line represents CviR complex with cyclo(Trp-Ser); (B) Black color line represents LasR complex with signaling molecule, while red line represents LasR complex with cyclo(Trp-Ser).

