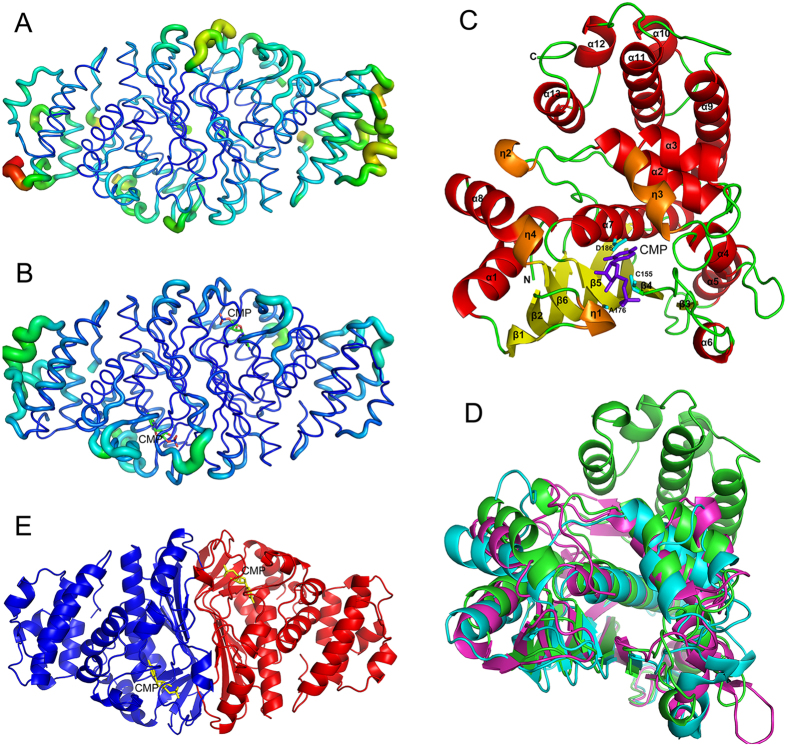
Figure 2. Overall structures of MilA and the MilA‒CMP complex.
(A,B) The structures of WT MilA (A) and the MilA‒CMP complex (B) are shown in cartoon representation and colored according to the B-factor. Blue and red represent the lowest and highest B-factor values, respectively. In addition, the thickness of the tube reflects the B-factor value in that the larger the B-factor, the thicker the tube. (C) Structure of the MilA‒CMP monomer. α-helices, β-sheets, and 310-helices are colored in yellow, red, and orange, respectively. CMP is depicted in purple. (D) Structural comparison of MilA (green), T4 CH (cyan, PDB code 1B5E) and TS (magenta, PDB code 1KZJ). (E) Structure of the MilA‒CMP dimer. The structure is viewed perpendicular to the two-fold axis of the dimer. The two protomers are shown in blue and red, respectively. Their bound CMP substrates are represented as yellow sticks.

