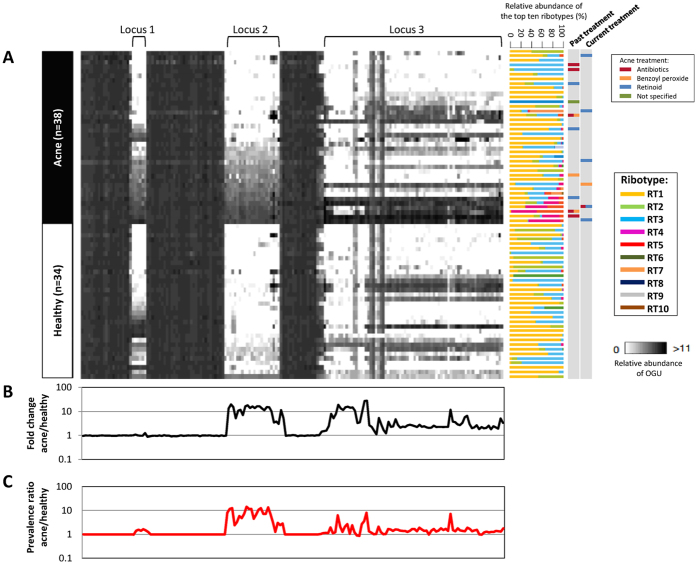
Figure 2. Differences in the relative abundances of P. acnes OGUs between acne patients and healthy individuals.
(A) A heat map showing the relative abundances of the OGUs in P. acnes loci 1, 2, and 3 in acne patients and healthy individuals. Each column represents an OGU, ordered based on the genomic location of the OGUs. OGUs 101–200 in the pan-genome were plotted to show locus 1, flanking OGUs, and locus 2. The 74 OGUs from locus 3, which is a plasmid, are also shown. Each row represents an individual. Acne patients (n = 38) and healthy individuals (n = 34, including those with age over 55) were compared. Individuals within each group were clustered based on the average relative abundance of locus 2 OGUs. Ribotype composition and past and current acne treatments are indicated on the right. Multiple treatments are depicted by more than one color. (B) Fold changes in relative abundance of the OGUs in loci 1, 2, and 3 between acne patients and healthy individuals. Acne-associated OGUs had a fold change >1, while health-associated OGUs had a fold change <1. (C) Prevalence ratio of the OGUs in loci 1, 2, and 3 between acne patients and healthy individuals. The presence of an OGU in a sample is defined as an OGU with at least 1X coverage after normalization.

