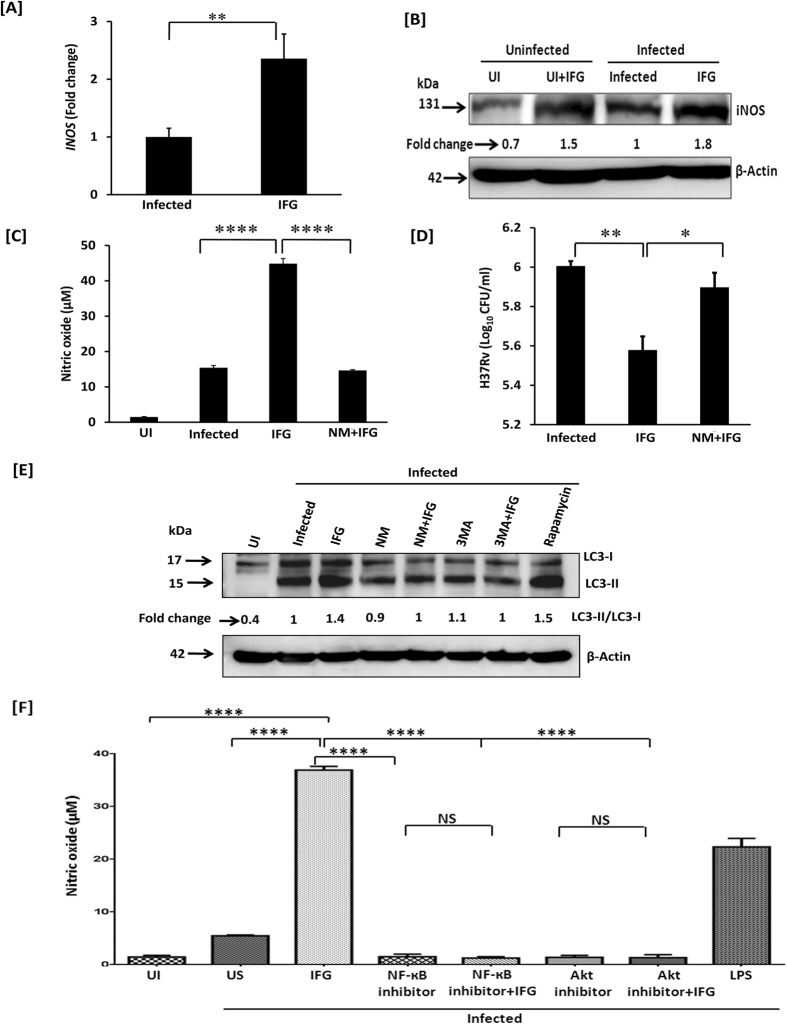
Figure 4. IFG restricts the intracellular survival of Mtb through the induction of iNOS.
Macrophages were infected with Mtb for 4 h. Later, cells were stimulated with IFG (64 ng/ml) for 24 h and monitored for the expression of [A] INOS gene by RT-qPCR; [B] iNOS by Western blotting and values [fold change] are shown through densitometry analysis. [C,D] The specificity of NO production and its role in Mtb killing is proven by NO inhibitor NM. The estimation of [C] NO was done by Griess method and [D] Mtb killing by CFUs. The impact of autophagy in the inhibition of the growth of Mtb was ascertained by the [E] conversion of LC3-I to LC3-II by Western blotting and densitometry values are shown as fold change. Actin was used as a loading control. [F]. The secretion of NO was inhibited by treating the cells with the inhibitors of Akt and NF-κB. LPS was used as a positive control. The specificity of autophagy was ascertained by blocking the conversion of LC3-1 into LC3-II by its inhibitors 3MA and NM. Rapamycin is used as a positive control of autophagy. The fold change was calculated considering the value of infected controls as 1. The data are representative of 2–4 independent experiments. UI: uninfected macrophages; Infected: infected macrophages and unstimulated (no IFG); IFG: Mtb infected macrophages and IFG stimulated, NM: N-monomethyl-L-arginine, 3MA: 3 methyl adenine. *p < 0.05, **p < 0.01, ****p < 0.0001.

