
Figure 2. High resolution SEM images of MTs and PFBs (highlighted by white and blue arrows, respectively).
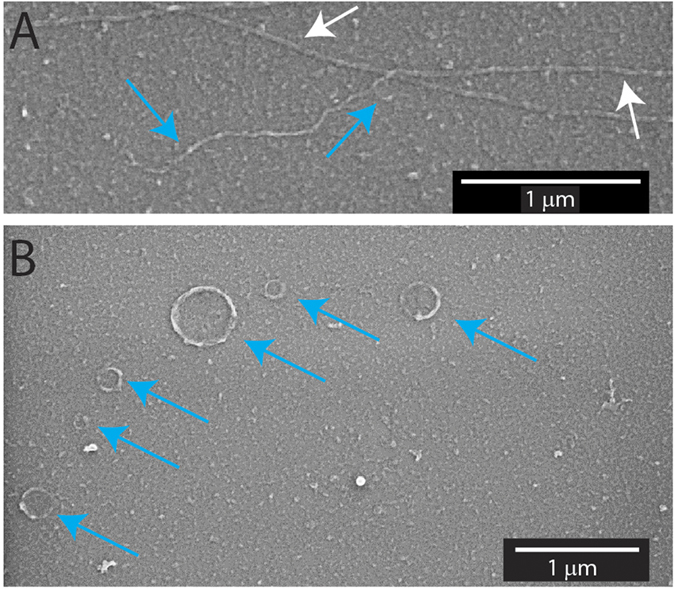
(A) Image of an intact MT and an overlapping MT whose end is splitting into PFBs. (B) PFBs displaying small radius of curvature.
Official websites use .gov
A
.gov website belongs to an official
government organization in the United States.
Secure .gov websites use HTTPS
A lock (
) or https:// means you've safely
connected to the .gov website. Share sensitive
information only on official, secure websites.
(A) Image of an intact MT and an overlapping MT whose end is splitting into PFBs. (B) PFBs displaying small radius of curvature.