
Figure 3. High resolution AFM images of MTs and PFBs (highlighted by white and blue arrows, respectively).
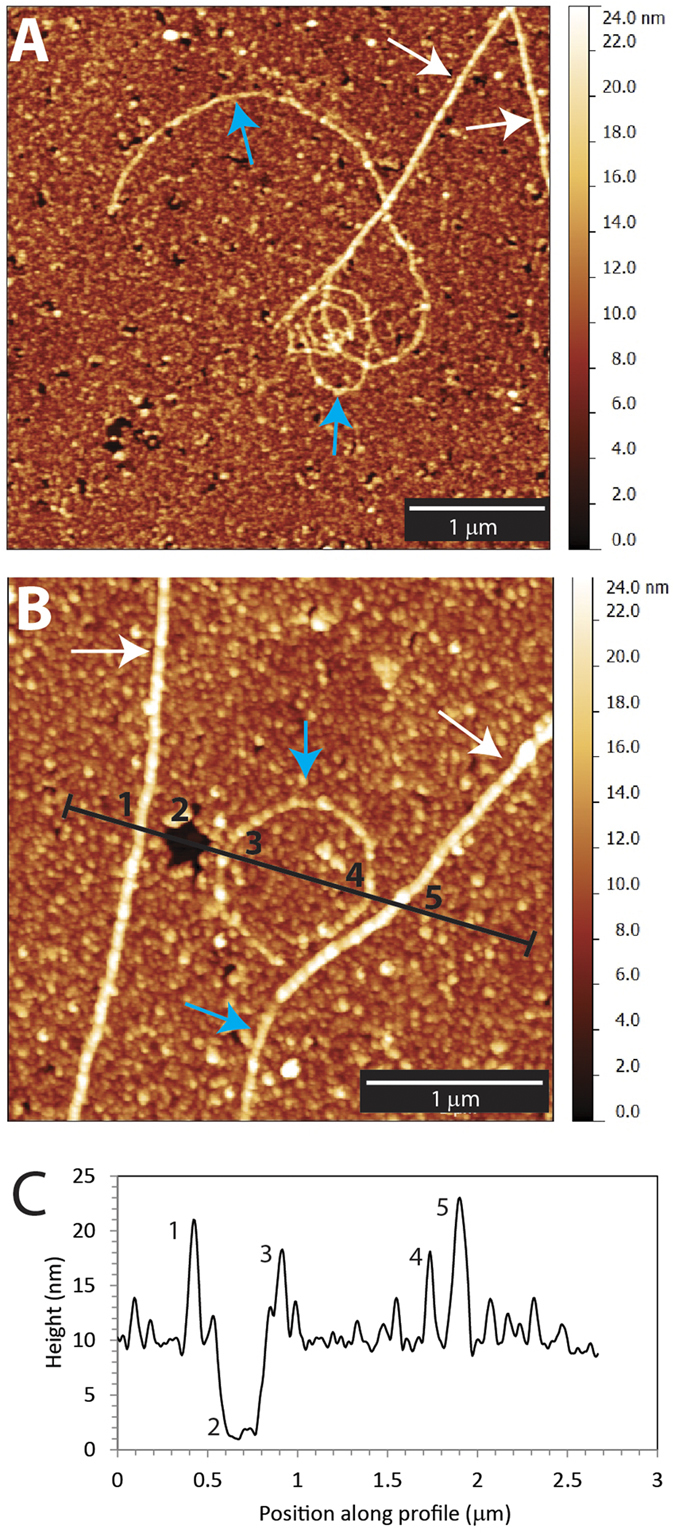
(A) Image of MT splitting to PFBs. (B) Image of a MT, curved PFB, and a MT with a PFB still attached to the end. (C) Example height profile along black line shown in (B), with corresponding MT and PFB peaks and glass surface are labeled in both (B) and (C).