
Figure 6. Relative transcription levels of five highly expressed proteins in the RH compared with the TgCtwh3 strain.
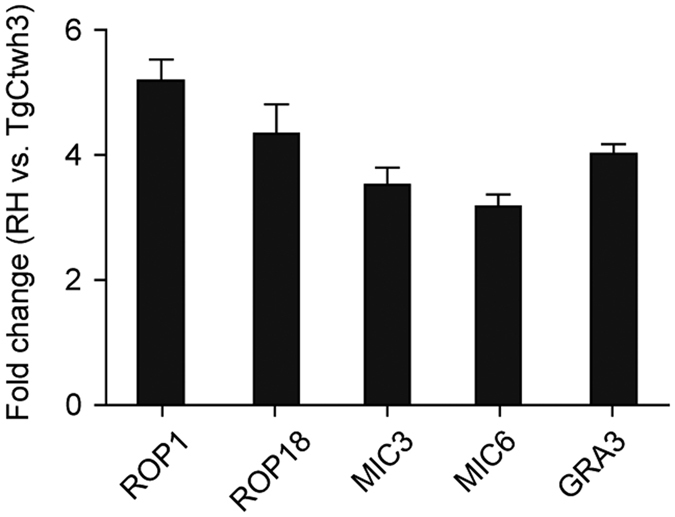
The samples were tested by quantitative RT-PCR using gene-specific primers (Supplementary Table S2), and GAPDH served as an internal control. Data are expressed as the means ± S.D. (n = 6). 1 = no change.