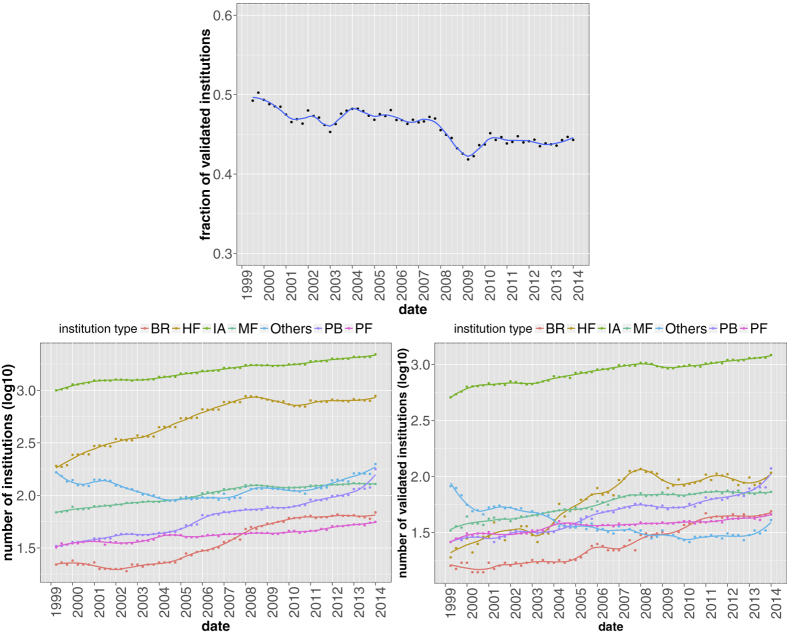
Figure 4. Fraction of institutions appearing in the validated network as a function of time (top panel); total number of institutions in the original bipartite network (bottom left panel) and number of validated institutions (bottom right panel) for the different institution types.
Solid lines correspond to a locally weighted least squares regression (loess) of data points with 0.2 span.

