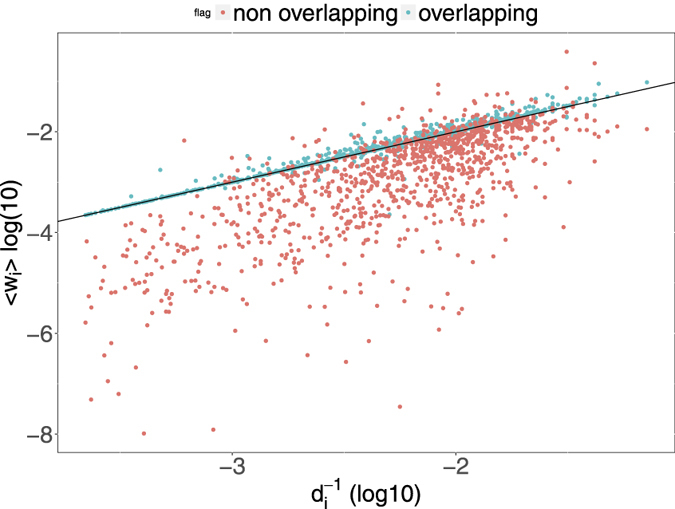
Figure 6. Scatter plot of the average share of securities market value in a portfolio 〈wi(t)〉 = ∑swis(t) versus the inverse of the portfolio diversification 1/di(t) for each institution i.

The average over all securities in a portfolio gives, by construction, the inverse of the institution’s degree (corresponding to the straight line in the plot). Here we divide the average share over overlapping securities (i.e., securities in the portfolio belonging to the overlap with a validated neighbor) and non-overlapping securities (the complementary set). We clearly see that overlapping positions correspond to larger shares in the portfolio. The plot refers to 2006Q4, yet the same qualitative behavior is observed for other dates.
