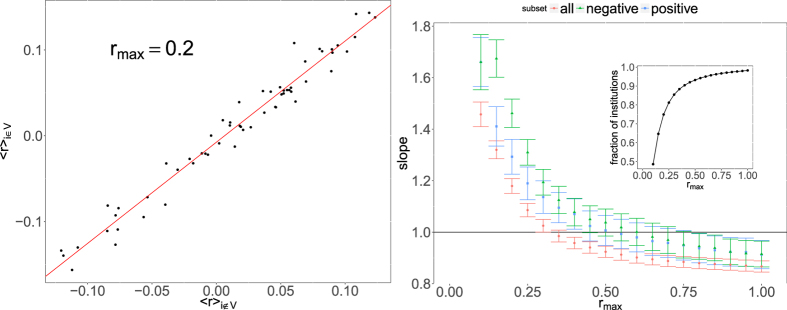
Figure 9. Returns for validated portfolios.
Left panel: average return of portfolios in the validated network vs average return in the complementary set. All returns for which |ri(t)| < rmax (here 0.2) are included. The straight line correspond to a linear regression of the data-points (one for each quarter). Right panel: value of the slope obtained as in the left panel as a function of rmax (see details in the text). When returns greater than roughly 30–40% are excluded the slope is found significantly larger than 1. This indicates that portfolios in the validated network tend to have higher returns (in absolute terms) than their not validated counterpart. The inset shows the overall fraction of returns satisfying |ri(t)| < rmax as a function of rmax.

