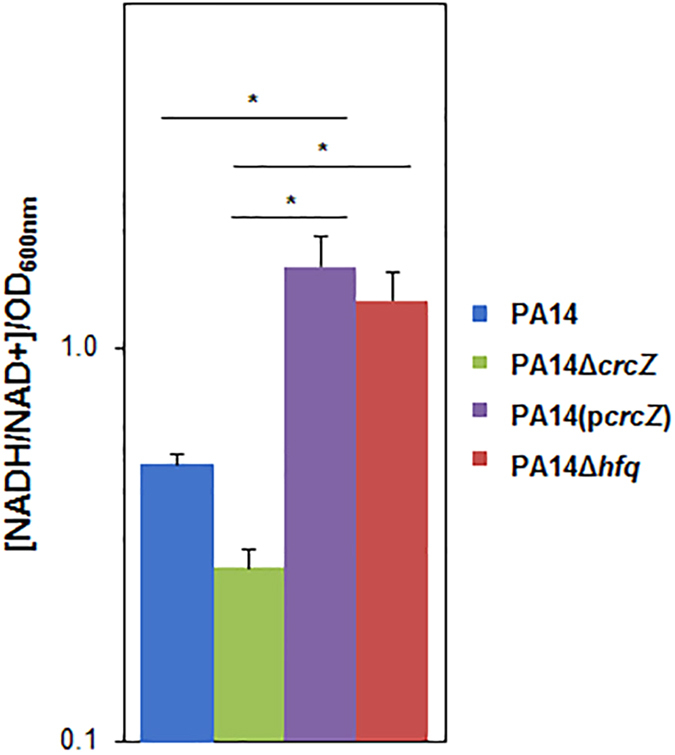
Figure 3. The absence of Hfq causes a redox imbalance.

The NADH/NAD+ levels were assessed in B-96 cultures of PA14 (blue bar), PA14ΔcrcZ (green bar), PA14(pcrcZ) (violet bar) and PA14Δhfq (red bar) grown in SCFM48. Error bars, mean ± s.d. N = 3 biological replicates with 3 technical replicates. *P < 0.05, analysed by one-way ANOVA with the Tukey’s HSD post hoc test.
