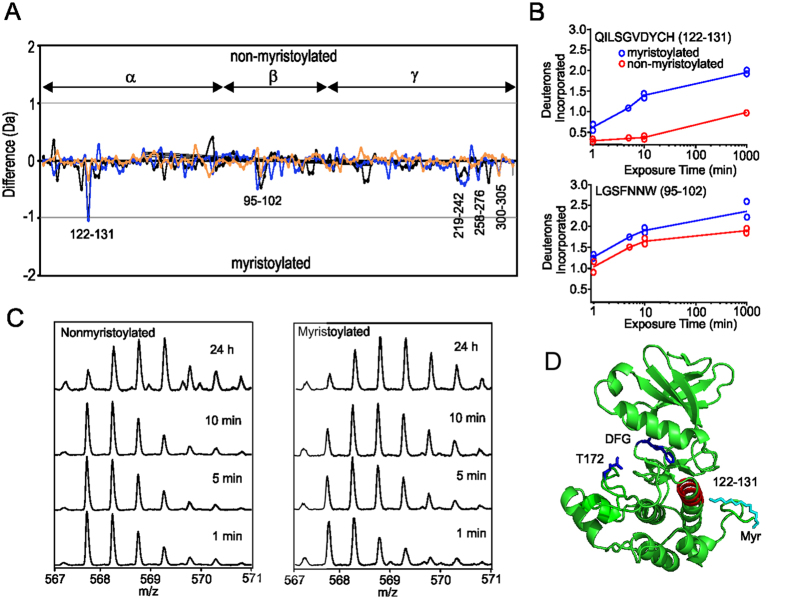
Figure 2. Comparison of deuterium uptake between myristoylated and nonmyristoylated AMPK.
(A) Difference plot of deuterium uptake for peptides of apo mysritoylated and non-myrisoylated AMPK. Changes in deuteration are shown at three time points: 1 min (orange), 5 min (blue) and 10 min (black). Each point is an average of two separate and independent experiments. On the y-axis a positive difference is indicative of increased deuteration for non-myristoylated AMPK peptides, whereas a negative difference is indicative of increased deuteration for myristoylated AMPK peptides. On the x-axis are individual peptides; assignment of peptide to subunit is shown. (B) Time course of deuterium exchange for residues 122–131 of the α-subunit and 95–102 of β-subunit. (C) ESI Q-Tof mass spectra of the α-subunit peptide 122–131 at different points of deuteration for non-myristoylated and myristoylated AMPK. (D) Location of the α-subunit peptide 122–131 mapped onto the structure of the kinase domain (pdb 4CFH). The position of the phosphorylation site, Thr172, and DFG of the activation loop are shown. In cyan is the position of the myristoyl group after superimposing the structure (pdb 1CMK) of the myristylated kinase domain of cAMP protein kinase, showing that the AMPK peptide 122–131 is near this position.

