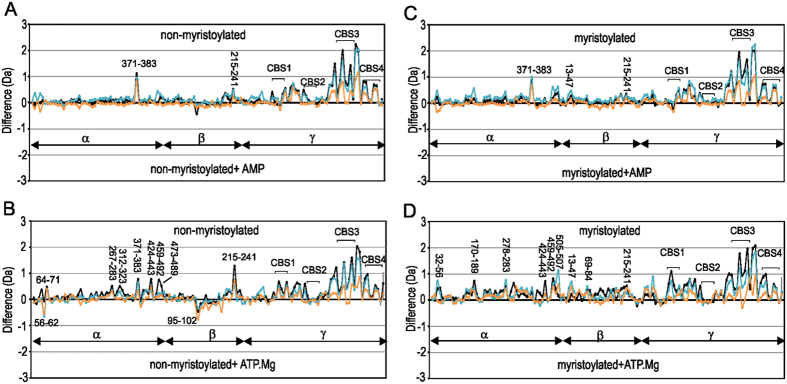
Figure 3. Comparison of deuterium uptake of myristoylated and non-myristoylated AMPK in the presence and absence of the nucleotides AMP and ATP.Mg2+.
Difference plots of non-myristoylated AMPK with and without (A) AMP and (B) ATP.Mg2+. Difference plots of myristoylated AMPK with and without (C) AMP and (D) ATP.Mg2+. For each plot changes in deuteration are shown at three time points: 1 min (orange), 5 min (blue), 10 min (black). Each point is an average of two separate and independent experiments. On the y-axis a positive difference is indicative of increased deuteration for peptides of the apo-states of AMPK, whereas a negative difference is indicative of increased deuteration for peptides of the nucleotide bound states of AMPK. On the x-axis are individual peptides; assignment of peptide to subunit is shown.

