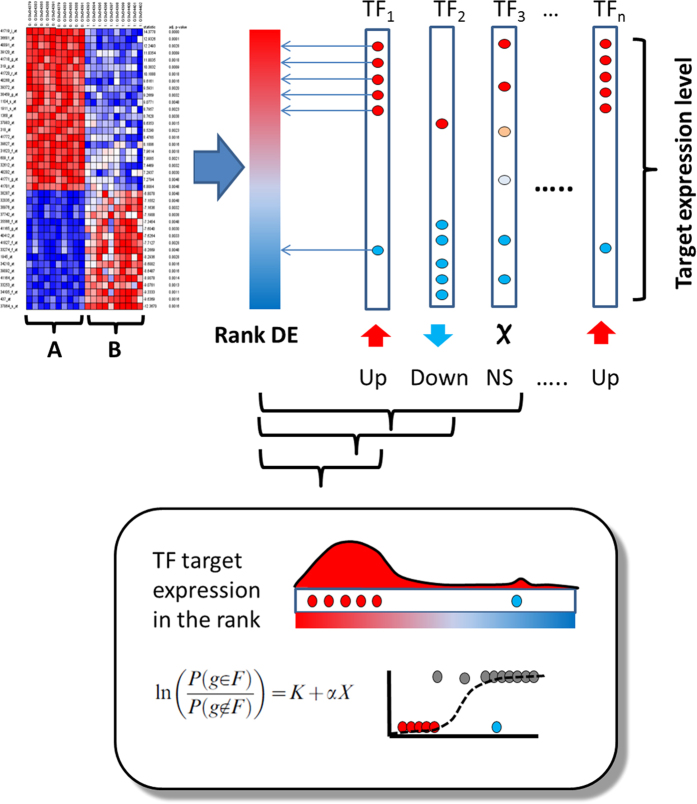
Figure 6. Schema of the TFTEA method to obtain TFs differentially activated between two conditions compared.
The method uses gene expression values and compares two conditions (A and B) by means of any test to obtain a rank of differentially expressed genes (Rank DE) based on the statistic. Then, for each TF, a logistic regression78 is applied to discover associations of the TF targets to high or low values of the rank (lower panel). Thus, targets of TF1 show a clear association to high values of the statistic, meaning that have significantly higher expression in condition (A) than in condition ( ), which demonstrated the differential activity of TF1. TF2 is the opposite case, in which the TF is significantly less active in (B) than in (A). TF3 have their targets active or inactive in both conditions, meaning that these activities are not a collective property and consequently are not due to TF3, but maybe to other regulators.

