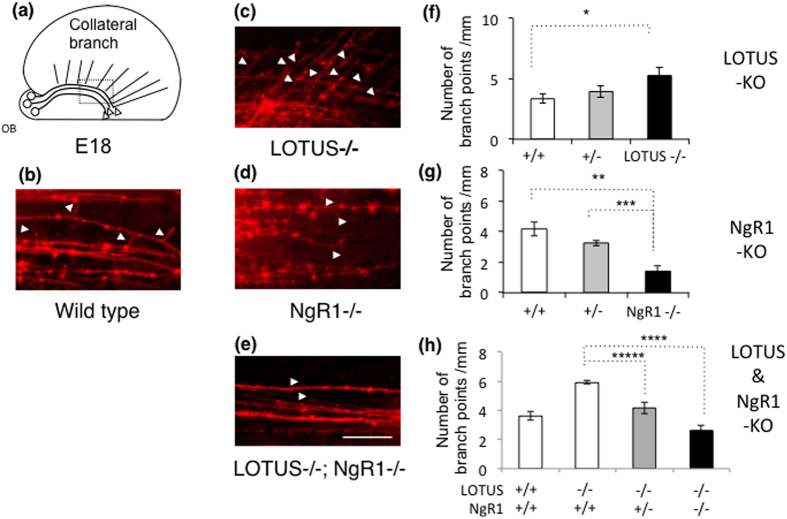
Figure 6. Functions of LOTUS and NgR1 in axonal branching of the LOT in vivo.
(a) Schematic drawing of the lateral view of axonal branching in the LOT. The dashed square indicates the position of branch point analysis. (b–e) Lateral views of LOT axonal branching in whole brain from lotus-deficient mice (LOTUS−/−) and ngr1-deficient (NgR1−/−) mice at E18. Compared to wild-type mice (b), the axonal branching points of the LOT were increased (white arrowheads) in LOTUS−/− (c), whereas the branching points in NgR1−/− were decreased (d). Abnormally increased axonal branching observed in LOTUS−/− was rescued in double homozygous mutants of lotus and ngr1 (LOTUS−/−; NgR1−/−) (e). Scale bar: 50 μm. (f–h) Quantitative analysis of branching points in the LOT. (f) Comparison of wild-type, LOTUS+/− and LOTUS−/− mice. (g) Comparison of wild-type, NgR1+/− and NgR1−/− mice. (h) Comparison of wild-type, NgR1+/− and NgR1−/− mice in the background of LOTUS−/− mice. Significance, indicated by (*), was analyzed using a Tukey’s one-way ANOVA test. (f) * is P = 0.031 (LOTUS+/+ versus LOTUS−/− (n = 5 littermates)). (g) ** is P = 0.00008 (NgR1+/+ versus NgR1−/− (n = 4 littermates)) and *** is P = 0.0016 (NgR1+/− versus NgR1−/− (n = 4 littermates)). (h) **** is P = 0.0001 (LOTUS−/−; NgR1+/+ versus LOUTS−/−; NgR1−/− (n = 3 littermates)) and ***** is P = 0.0076 (LOTUS−/−; NgR1+/+ versus LOTUS−/−; NgR1+/− (n = 3 littermates)).

