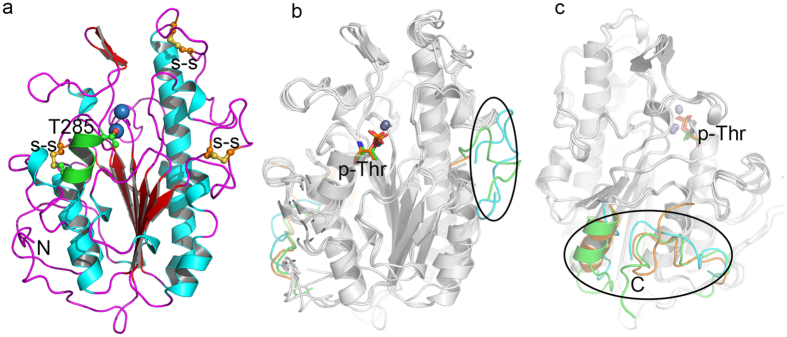
Figure 1. Overall structure of MCR-1C and comparison with LptA and EptC.
MCR-1C, LptA (PDB: 4KAY), EptC (PDB: 4TN0) are shown in cartoon representation. The labeled key residues and active site metal ions are represented in ball-and-stick and sphere, respectively. (a) Overall structure of MCR-1C. The nucleophilic residue T285 and three disulfide bridges are shown as ball-and-stick. The helix locked by a disulfide bond to the central β sheet is shown in green. (b,c) Structural superimpositions (front and back view) of MCR-1C, LptA and EptC are shown in grey. The significant variable loops are highlighted in cyan (MCR-1C), green (LptA) and orange (EptC).

