
Figure 3. Effect of GD exposure on intracellular ROS generation in human lung cells.
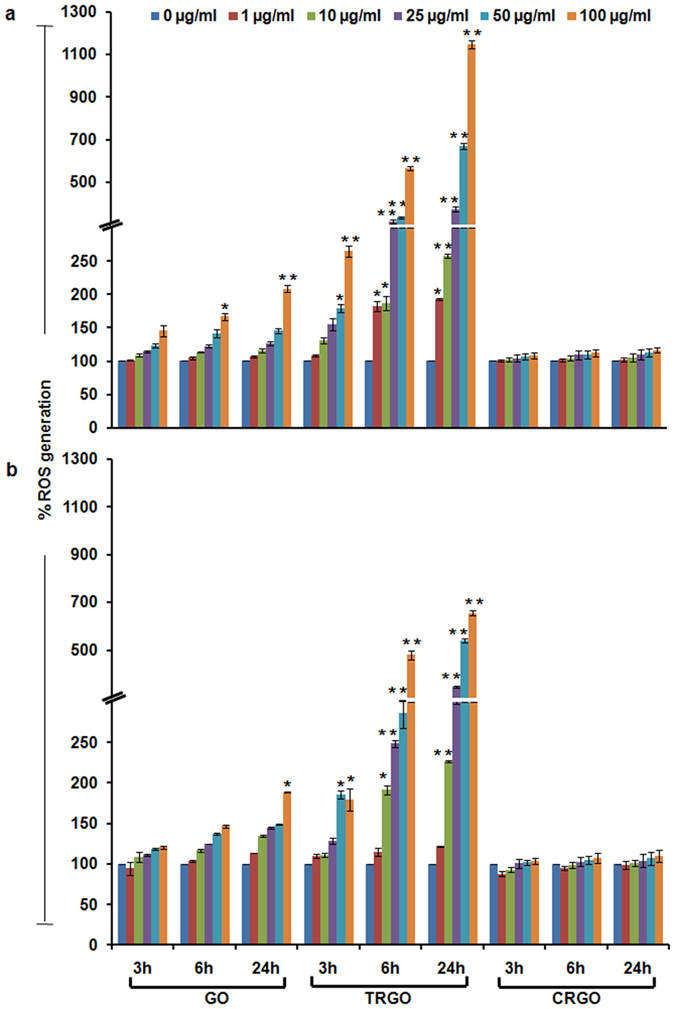
DCFDA assay was carried out for the assessment of ROS production in GO, TRGO and CRGO exposed (a) A549 cells and (b) BEAS-2B cells after 3 h – 24 h time period at a concentration range of 1–100 μg/ml which indicate a strong oxidative potential of TRGO compared to GO and CRGO. The A549 cells were found to be more affected by the ROS which subsequently deplete intracellular glutathione content compared to BEAS-2B cells. Data represents mean ± SE of three independent experiment. *p < 0.05, **p < 0.01, compared to control value.