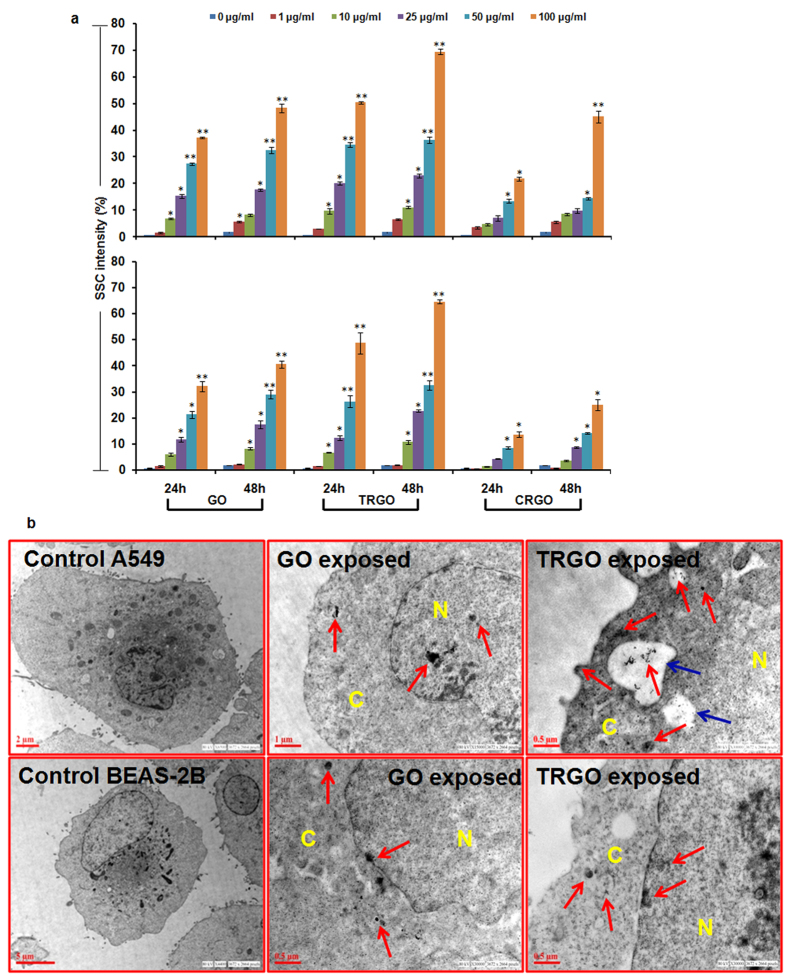
Figure 7. Cellular internalization assessment of GD in human lung cells.
(a) Flow cytometry based analysis showed a significant increase in SSC intensity of A549 cells (upper panel) as well as BEAS-2B cells (lower panel) with more prominent effect in TRGO exposed cells. (b) Representative TEM photomicrographs showing the accumulation of GO and TRGO in cytoplasm (denoted by C) as well as in nucleus (denoted by N) with induction of vacuolization (blue arrow) in TRGO exposed A549 cells. Red arrow showing the presence of GD inside the cells. Data represents mean ± SE of three independent experiment. *p < 0.05, **p < 0.01, compared to control value.

