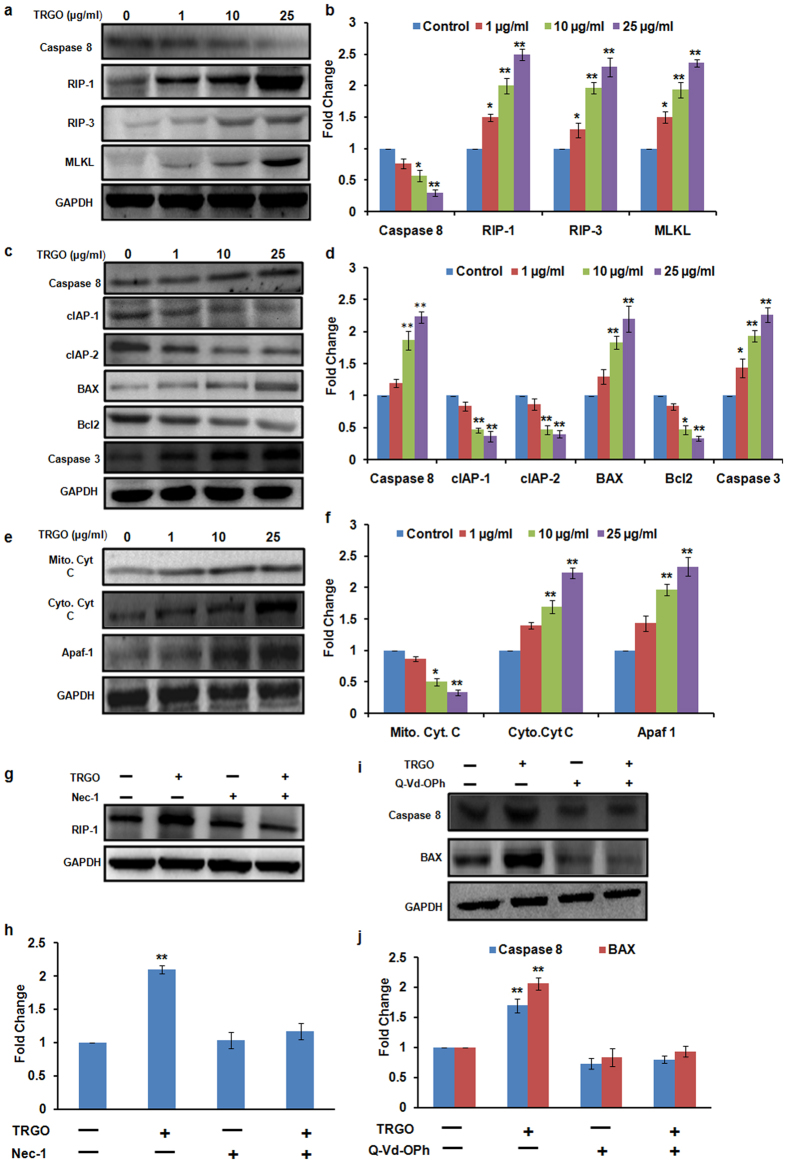
Figure 8. Western blot analysis of GD exposed cells for the evaluation of cell death pathway.
A significant increase in the expression level of necroptotic protein in A549 cells (a) whereas increase in apoptotic protein in BEAS-2B cells (c,e) was found after the 24 h exposure of TRGO. (b,d,f) Quantitation was done in Biorad Versa DOC (Bio-Rad Laboratories, Inc. Hercules, USA) with the help of Quantity One Quantitation Software version 4.3.1 and expressed in fold change. Further, in the presence of Nec-1 (g) and Q-Vd-OPh (i) the expression level of respective proteins was found to get attenuated which confirmed the activation of differential cell death pathway upon GD exposure. (h,j) Quantitation was done in Biorad Versa DOC (Bio-Rad Laboratories, Inc. Hercules, USA) with the help of Quantity One Quantitation Software version 4.3.1 and expressed in fold change. Full lengths blots were shown in Fig. S11.

