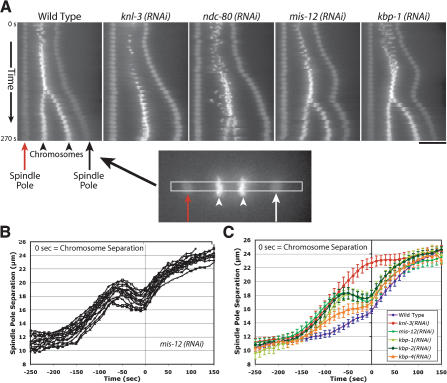
Figure 6.
Depletion of MIS proteins results in a unique spindle “bounce” phenotype. (A) Still images from time-lapse movies of embryos expressing GFP-histone H2B and GFP-γ-tubulin were processed using an algorithm to fix the X-Y coordinate of one spindle pole (red arrow) throughout a movie and to rotate each frame such that the second spindle pole was at the same Y-coordinate. A 12-pixel-wide rectangular strip that included both spindle poles was cut from each frame and vertically montaged to generate a kymograph. The kymographs were initiated at NEBD, and the time interval between consecutive strips was 10 sec. In the kymographs, separation of both spindle poles (arrows) and the chromosomes (arrowheads) is visible. Bar, 10 μm. (B) Graph showing traces of spindle pole separation in 15 individual MIS-12-depleted embryos time aligned with respect to the onset of visible chromosome separation. (C) Graph plotting average spindle pole separation versus time for wild-type (n = 15), KNL-3-depleted (n = 18), MIS-12-depleted (n = 16), KBP-1-depleted (n = 11), KBP-2-depleted (n = 20), and KBP-4-depleted (n = 10) embryos aligned with respect to the onset of visible chromosome separation. The kinetic profiles for MIS-12-, KBP-1-, and KBP-2-depleted embryos are virtually indistinguishable. Because there is no chromosome separation in KNL-3-depleted embryos, the KNL-3 trace was aligned to maintain the same relationship with the wild-type trace shown in Figure 1. The average maximum elongation rates are 4.6 μm/min for mis-12(RNAi); 5.7 μm/min for kbp-1(RNAi); 5.0 μm/min for kbp-2(RNAi); 5.4 μm/min for knl-3(RNAi); 5.4 μm/min for ndc-80(RNAi); and 2.5 μm/min for wild-type prometaphase spindle elongation. Error bars represent the S.E.M. with a confidence interval of 0.95.

