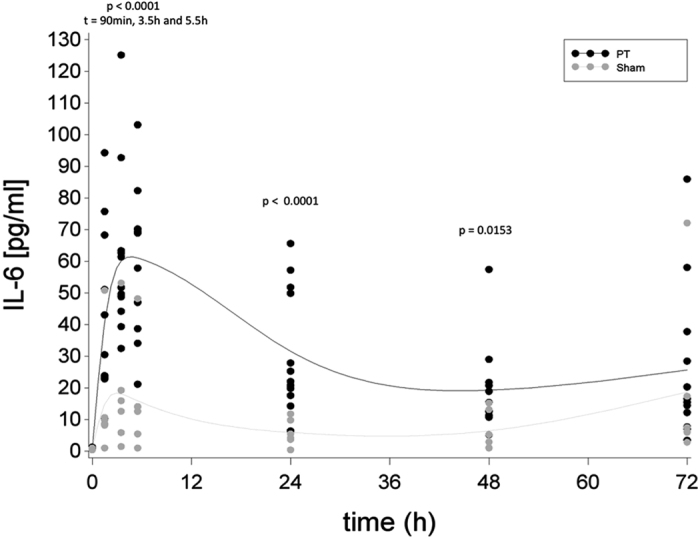
Figure 3. Levels of systemic interleukin (IL)-6 over time ratio in the Polytrauma (PT) and the Sham group approximated by a cubic spline function with mean values as nodes.

Black dots indicate individual values of PT animals at each measurement moment, grey dots indicate individual values of sham animals at each measurement moment.
