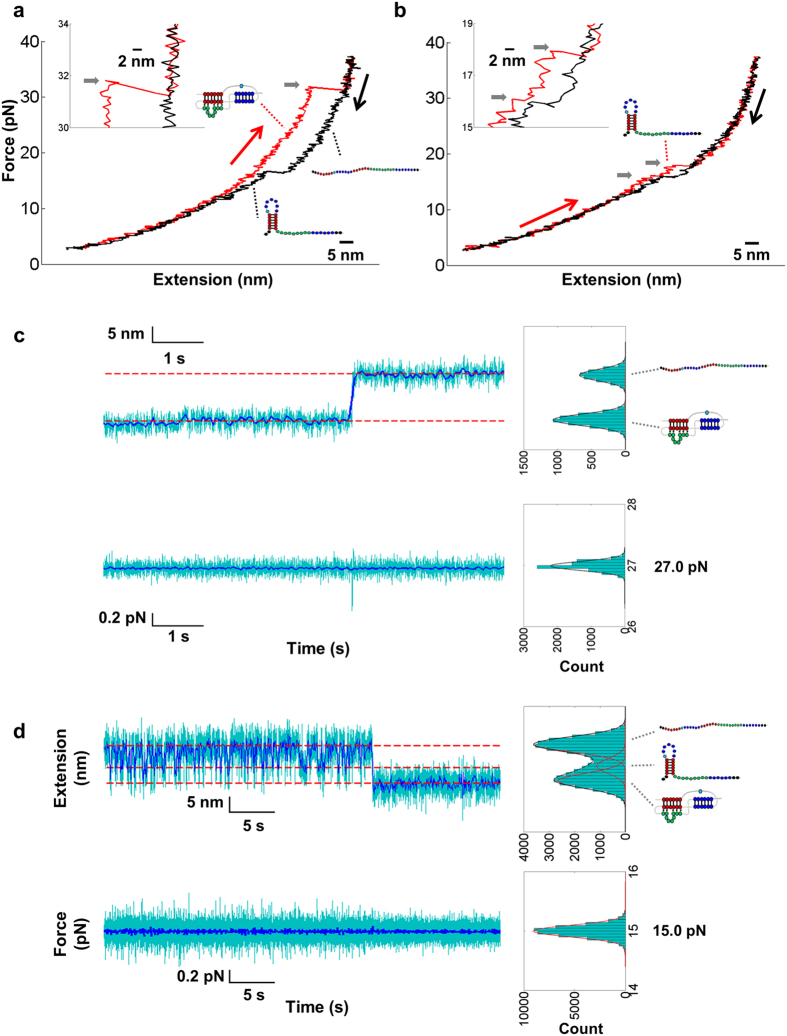
Figure 4. Representative single-mechanical (un)folding traces.
(a,b) Representative force-ramp pulling traces observed for SF209 with a typical one-step unfolding pathway (a) and a rarely observed two-step unfolding pathway (b). The curves are smoothed to 100 Hz. Red curves are unfolding traces and black curves are refolding traces. The unfolding force is indicated by a horizontal grey arrow. (c,d) Representative force-jump traces for the one-step unfolding and two-step refolding of SF206 at 27.0 and 15.0 pN, respectively. The 1000 Hz data (cyan) were subsampled to 20 Hz (blue). The dashed lines indicate the Gaussian distribution fitting results. Extensions were binned to 1 nm, and forces were binned to 0.05 pN.

