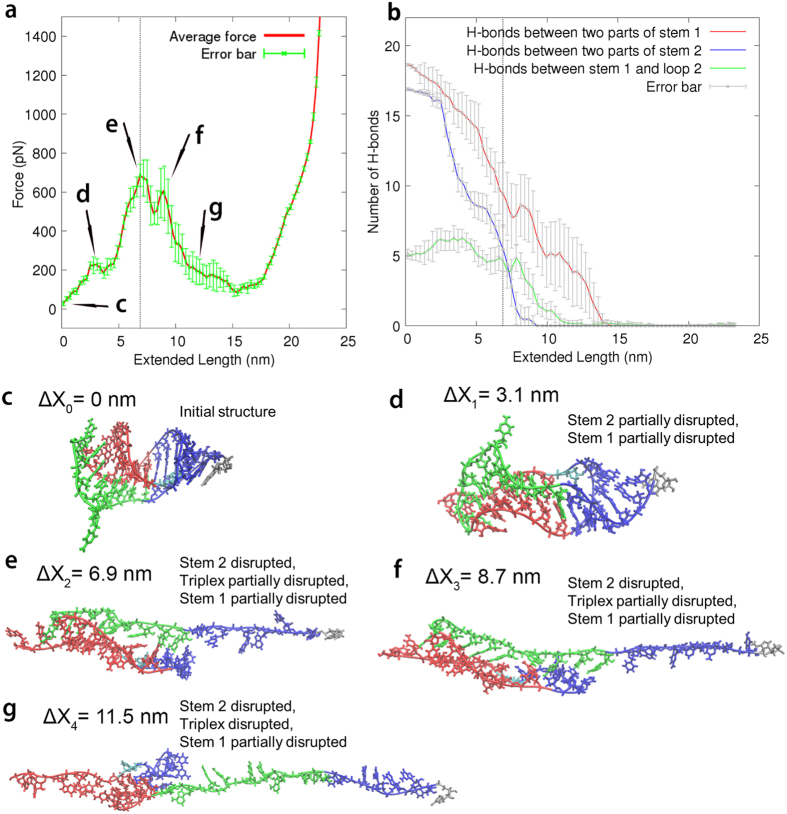
Figure 6. SMD simulation results for SF206.
(a) An averaged curve of a total of 10 independent pulling simulations. The green error bars are 95% confidence intervals. The end-to-end distance is defined as the distance between the O3′ atom of the 3′ terminal residue A and the O5′ atom of the 5′ terminal residue G. The vertical dotted lines in panels a and b correspond to the highest peak. (b) Averaged number of hydrogen bonds formed as a function of extension based on the 10 independent simulations. (c–g) Structural snapshots corresponding to the positions in panel a. The snapshots are taken from a representative simulation.

