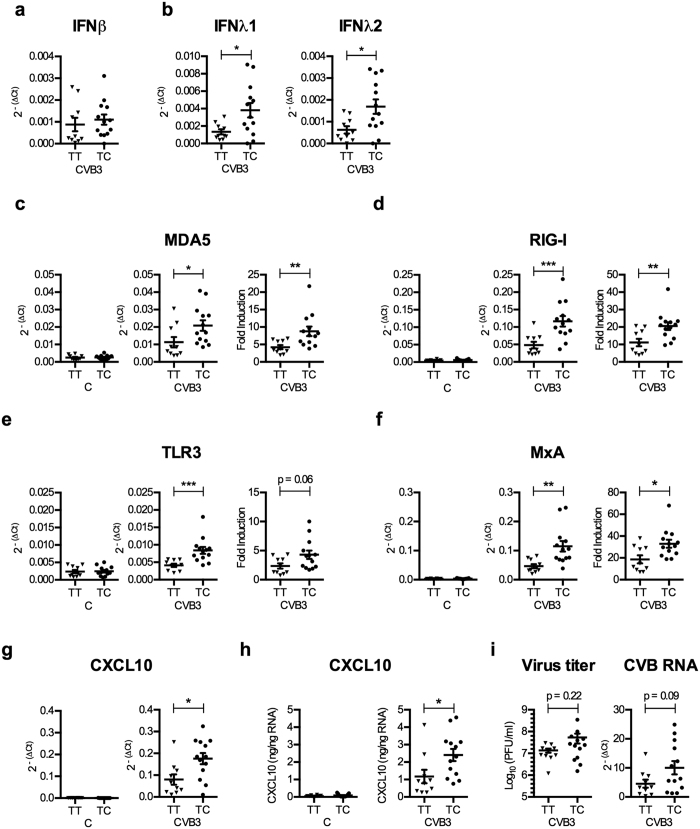
Figure 3. Homozygosity for the T (Thr946) allele of the rs1990760 polymorphism is associated with low human islet type III IFN and ISG mRNA expression levels, as well as amounts of secreted CXCL10, following CVB3 infection.
(a and b) IFNβ (a), IFNλ1 and IFNλ2 (b) mRNA expression levels measured at 48 h p.i. in the CVB3 infected islets described in Fig. 2 (n = 23) were re-analysed and the donors stratified according to the rs1990760 genotype (TT or TC). The expression levels were normalized to that of GAPDH and presented as 2−(ΔCt) (relative expression) for all islets. (c–g) mRNA expression levels of PRRs (MDA5, RIG-I, TLR3; (c–e), genes involved in antiviral defence (MxA; (f) or chemoattraction (CXCL10; (g), measured at 48 h p.i. in the mock-infected (left column, C) and CVB3 infected (two right columns, CVB3) islets described in Fig. 2 (n = 23) were re-analysed by dividing the donors according to the rs1990760 genotype (TT or TC). The expression levels were normalized to that of GAPDH and presented as 2−(ΔCt) (relative expression; the two left columns), or normalized to GAPDH and compared to the expression levels in mock-infected islets from the same donor and presented as 2−(ΔΔCt) (fold induction: the right column). Fold induction calculation was not applicable to IFNβ, IFNλ1–2 and CXCL10 mRNA, which were undetectable in mock-infected islets). (h) The amount of secreted CXCL10 protein (see Fig. 2g) was measured in supernatant harvested from mock-infected (left column, C) and CVB3 infected (right column, CVB3) islets using ELISA and expressed as ng/ng isolated RNA. The islet donors were stratified according to rs1990760 genotype TT or TC. (i) The data described in Fig. 2 was re-analysed and the islets were divided according to the rs1990760 genotype (TT or TC). Titers of replicating virus in supernatants harvested at 48 h p.i. are presented as Log10(PFU/ml). The expression levels of virus RNA in CVB3 infected islets were measured using quantitative real-time PCR. The expression levels were normalized to that of GAPDH and presented as 2−(ΔCt) (relative expression). Data is shown as mean ± SEM, *p < 0.05, **p < 0.01, ***p < 0.001, Mann-Whitney test.

