Figure 7.
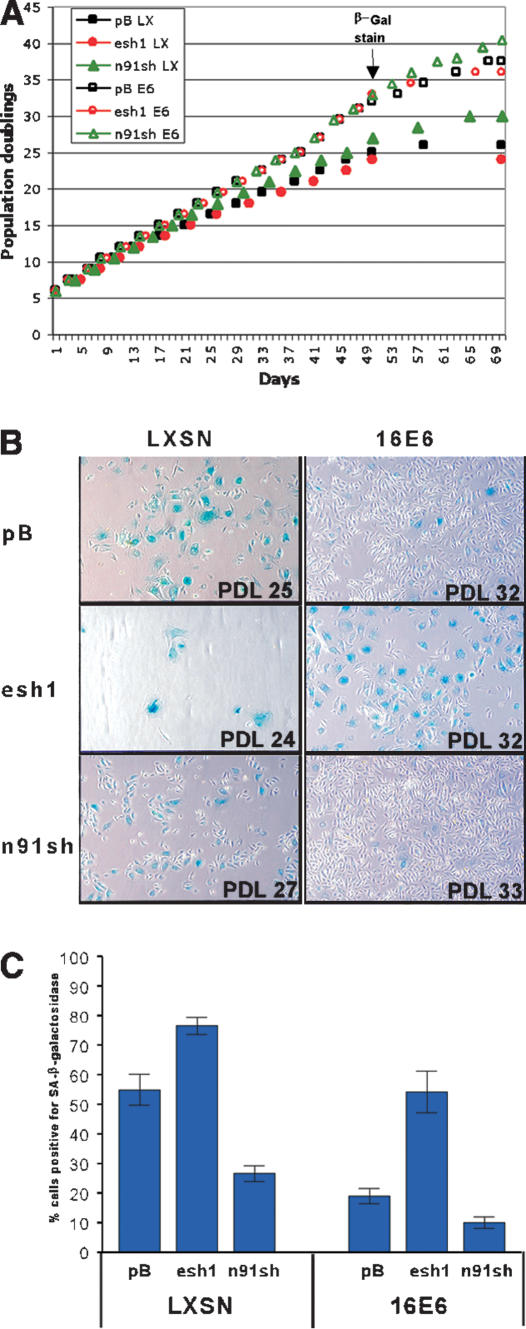
Senescence-associated β-galactosidase activity in late-passage HFKs. (A) Growth curves. HFKs expressing the indicated shRNA and LXSN (closed symbols) or E6 (open symbols) were grown in culture for ∼2 mo. The pBabe vector control is indicated by black squares, the esh1 cells are represented by red circles, and the n91sh cells are indicated by green triangles. The time point at which cells were stained for SA-β-galactosidase is indicated. (B) Micrographs of SA-β-galactosidase staining of late-passage HFKs expressing the indicated shRNA and LXSN empty vector or LXSN-16E6. The blue staining indicates senescent cells. (C) Quantitation of SA-β-galactosidase staining seen in B. The data represent the average percent of blue cells counted in four different fields at 100× magnification. The error bars indicate the standard error of the mean.

