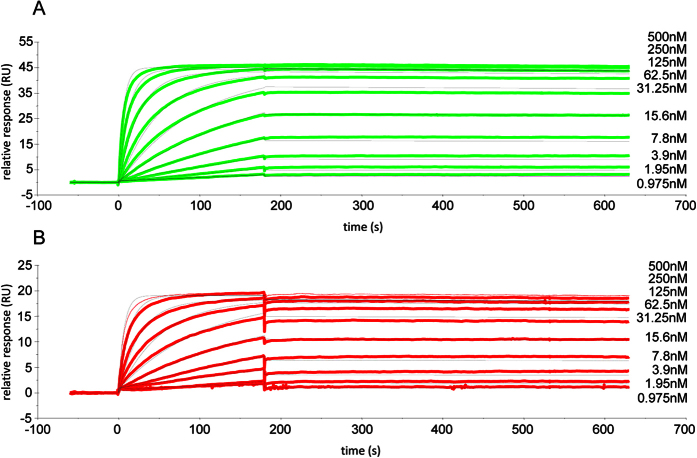
Figure 3. Sensorgrams of surface plasmon resonance (SPR) measurement for the determination of humAbAMA1 affinity to AMA1 (3D7).
The affinity of the antibody humAbAMA1 was estimated by SPR spectroscopy. For each cycle recombinant and purified humAbAMA1 either produced in N. benthamiana (A, green sensogramms) or produced in HEK293-6E cells (B, red sensograms) was captured on a Protein A surface (65 RU for N. benthamiana produced or 32 RU for HEK produced humAbAMA1). Subsequently, the antigen AMA1 (3D7) was injected at concentrations of 500 nM, 250 nM, 125 nM, 62, 5 nM, 31.25 nM, 15.6 nM, 7.6 nM, 3.9 nM, 1.95 nM and 0.975 nM for 180 s, followed by a buffer injection step for 420 sec. To determine kinetic constants, the data was fitted using a 1:1 Langmuir interaction model using the software BIAEval 4.0. Fit curves are shown in light grey.

