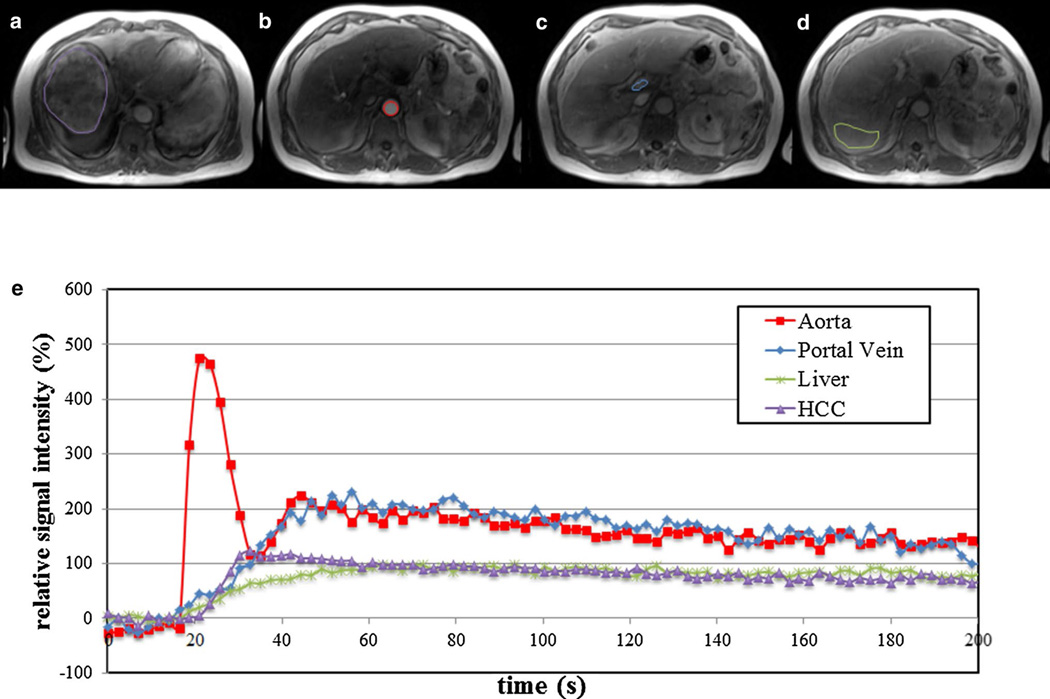
Fig. 1.
66 year old male patient with large HCC in the right hepatic lobe (13 cm). Axial DCE-MR images acquired using 3D-FLASH sequence at 1.5T (TR/TE/FA 2.74/1.09/11.5°, matrix 192 × 106, slice thickness 4 mm, acceleration factor 3, 44 slices, 100 time points with temporal resolution of 2.02 s) demonstrate ROI placement in different regions at different time points: tumor (purple) acquired at 20 s post injection (a), abdominal aorta (red) (b, 11 s post injection), main portal vein (blue) (c, 28 s post injection), and liver parenchyma (green) (d, 55 s post injection). Plots below e demonstrate relative signal intensity versus time curve [y axis: 100 × (SI/SI0−1), with SI and SI0 representing the signal intensity and signal intensity before enhancement, respectively]. Plot shows fast enhancement and subsequent washout of HCC as opposed to slow enhancement of liver parenchyma

