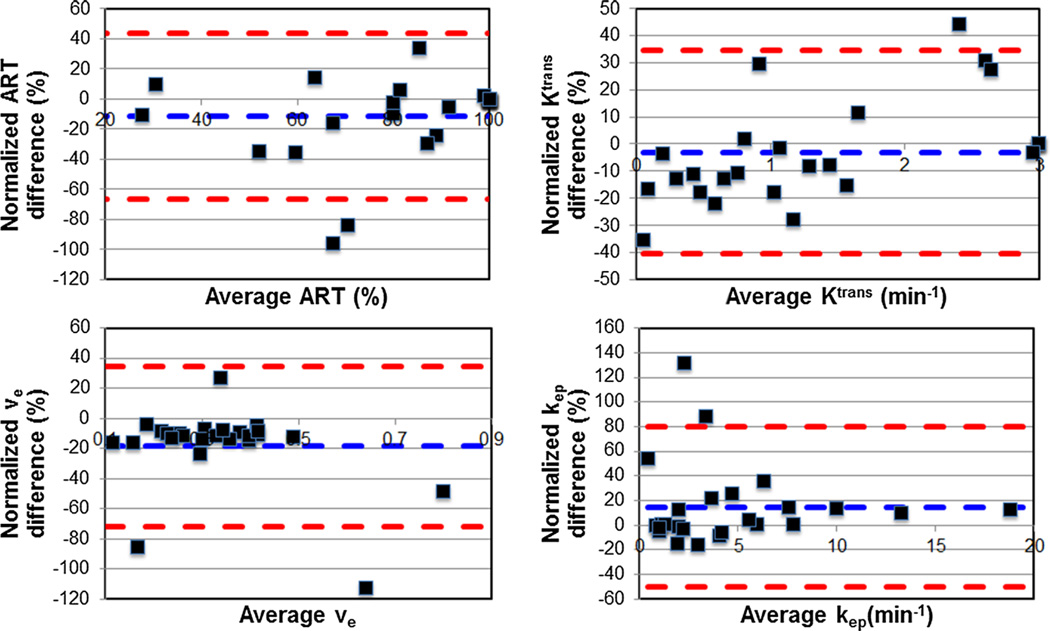
Fig. 2.
Bland–Altman plots show the comparison of HCC perfusion parameters obtained with Tofts and Shutter-Speed models (differences were normalized by average parameter values). Resulting Bland–Altman limits of agreement (red dash line) are smaller than Bland-Altman limits of agreement for test–retest variability (see also Tables 2 and 3)

