
Figure 1.
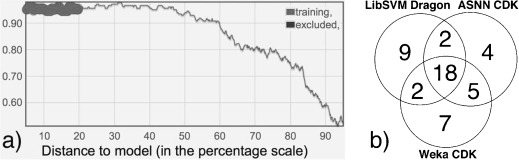
(a) Accuracy plot (y‐axis provides the ratio of correct predictions) for the WEKA model based on CDK descriptors with Bagging‐STD as distance to model. The 20 % of compounds with the lowest distance to the model, used for determination of outliers, are emphasized in the plot. (b) Venn diagram of the overlap of excluded compounds regarding 50 % of the lowest distance‐to‐model compounds (for the three best models of the whole dataset).