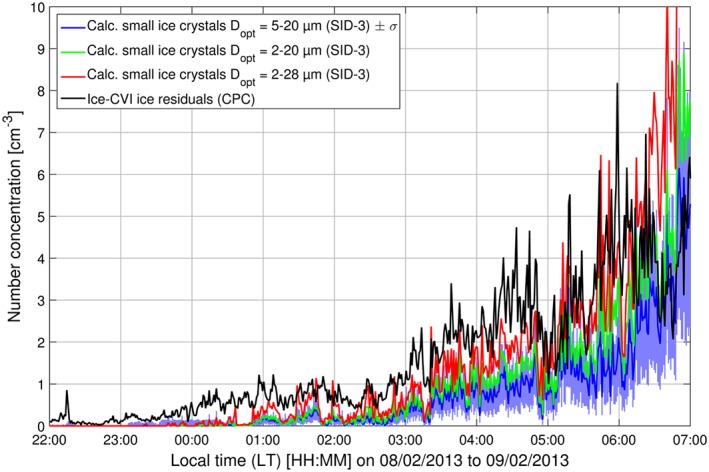
Figure 2.

Time series of small ice crystals (D opt size ranges of 5–20 μm, 2–20 μm, and 2–28 μm) number concentrations measured by the SID‐3 and ice residual number concentrations measured by the Ice‐CVI CPC during CLACE 2013, 22:00 LT, 8 February 2013 to 07:00 LT, 9 February 2013.
