
Figure 5.
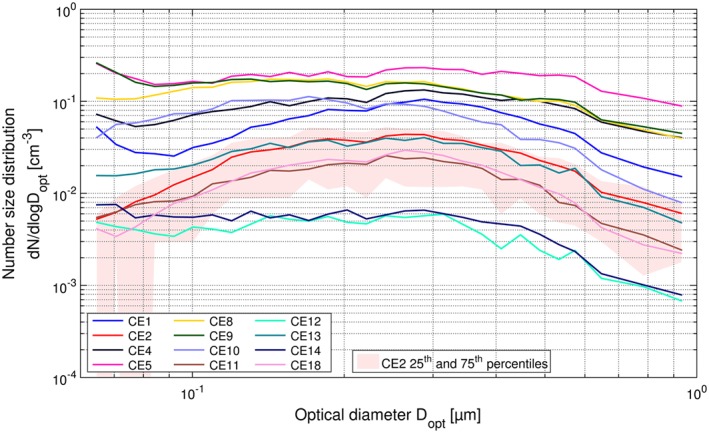
Cloud event averaged ice residual number size distributions measured by the UHSAS (10 min time resolution) during CLACE 2013. Interquartile variability of 10 min averages during a single cloud event is shown for CE2 as an example.
Official websites use .gov
A
.gov website belongs to an official
government organization in the United States.
Secure .gov websites use HTTPS
A lock (
) or https:// means you've safely
connected to the .gov website. Share sensitive
information only on official, secure websites.
Cloud event averaged ice residual number size distributions measured by the UHSAS (10 min time resolution) during CLACE 2013. Interquartile variability of 10 min averages during a single cloud event is shown for CE2 as an example.