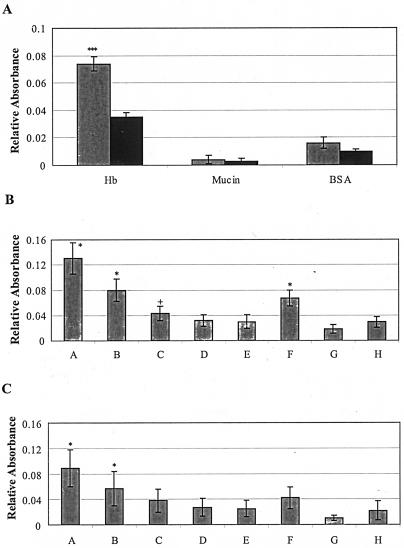
FIG. 3.
Adherence of Tshs to hemoglobin and ECM proteins. (A) Tshs binds to hemoglobin. BSA, mucin, and hemoglobin were each coated onto a 96-well microplate. Purified Tshs was added to each well. Binding was detected with a horseradish peroxidase-conjugated anti-rabbit IgG antibody. The negative control reactions did not contain Tshs. Hb, hemoglobin with Tshs (left) and negative control with hemoglobin and buffer (right); mucin, mucin with Tshs (left) and negative control with mucin and buffer (right). BSA, BSA with Tshs (left) and negative control with BSA and buffer (right). Three independent assays were carried out with four wells for each reaction in every experiment, and the average values, with the background values subtracted, are presented with a 95% confidence interval. ***, P < 0.001 compared to the control (Student's t test). (B and C) Adherence of purified Tshs and TshsS259A to ECM proteins. Binding to collagen IV (B) and fibronectin (C) was detected by ELISA at an absorbance of 450 nm. Lanes A through E correspond to decreasing concentrations of purified Tshs incubated with the ECM protein in each case. Three independent experiments were carried out with each reaction in triplicate, and the values presented correspond to the means of the measured absorbance with the background value subtracted. Lanes: A, 10 μg of Tshs; B, 5 μg of Tshs; C, 1 μg of Tshs; D, 0.1 μg of Tshs; E, 0.05 μg of Tshs; F, 10 μg of TshsS259A; G; 10 μg of Tshs without primary antibody; H, 10 μg of BSA. *, P < 0.05 compared to the controls (Tukey's honest significant difference test on an analysis of variance model). Absorbances increase linearly with concentration (E to A) (linear regression, P < 0.001). Values indicated by + become significant at the 90% confidence level.

